Interview - Datainsight / Alerting Engine
Data Insight
Your company is developing a new cloud-based analytics platform, "DataInsight," designed to provide advanced data processing and visualization capabilities for enterprise clients. The platform integrates with various data sources (telemetry metrics) utilizes machine learning for predictive analytics, and offers a highly interactive and customizable dashboard for end-users.
Technical architecture
- Ingestion to database
- Database to services (visualization and analytics including ML)
Integration Setbacks (Technical Problem)
The platform struggles to integrate smoothly with a
- wide range of customer databases especially legacy systems
- causing delays
- data inconsistency issues.
- Common set of communication protocols from client sensors too
Assumption
- We have standardized data at our end in Influxdb
- Clients (50-5000) -
- Branches / Locations - (less - 500-2,50,000)
- Sensors - measurement (500 sensors, millions)
- Branches / Locations - (less - 500-2,50,000)
- Table schema
- (row oriented, column oriented, non-normalized)
- Clients
- client_id pk
- Locations
- client fk
- location_id pk
- Raw Sensor Data
- location_id fk
- sensor_type_fk - fk
- values
- timestamp
- Sensor Type
- id
- sensor_id - 5
- parameter - 1 (temp)
- metadata - temp (5, 1), humidity (5, 2)
- pk - (sensor_id + parameter)
- Query
- Aggregate - last week average
- 15-16 values
- Device (not a table) - AC
- What temp i am set at
- What current and voltage i am consuming
- Clients (50-5000) -
- Multi-tenant / single-tenant
- multi-tenant system
Problems
- wide range of customer databases
Solutions
- Standard set of Ingestion APIs, so integration should be simpler
- Producers can be standardized
- Serialization / deserialization
Technological Hurdles (Technical Problem)
The machine learning models are not performing as expected, leading to inaccurate predictions and inefficient data processing. The cause is unclear, whether it's due to poor model selection, inadequate training data, or something else.
Visualization (end to end from databases to visualization service)
Assumption
- Sensor
Tech architecture
- Database
- Backend service
- APIs for highcharts that will give the sensor data
- Batch reporting apis
- Frontend service - show users the end data
- IAM
- React / Angular - Client side rendered
- Client side app
- Don't need to send containers all the time
- Responsive - Desktop / Mobile
- Visualization library - highcharts
Questions
- How much data (10 years, 1 years)
- Roll ups
- Accuracy of old data
- Data tiering
- Query speed
- Batch Reporting - for downloading large datasets, export
- Add queueing and do asynchronous processing
- Wait for data, either in mail, or downloads page
- Real time analytics
Low Latency Alerting System
Time series data is being published from loT devices(MQTT) across the building. There are various data types like efficiency, energy consumption, equipment on/off, etc.
The user wants different categories of alerts like critical, high, medium, and low.
- Critical - need to be initiated instantly. (within milliseconds)
- High - need to be initiated within 10 seconds to 1 minute.
- Medium - need to be initiated within 5 minutes - 6 hours.
- Low- can be sent up to once a day or week.
Whenever an alerting condition is met, it should trigger an alert and send it to all subscribed users via their preferred mode in the given below template-
- Alert Summary
- Timestamp
- Priority
- Asset Name
- Suggested Action For e.g Most likely Automation commands are not working on the chiller, Please switch the chiller to JouleTrack mode, turn it on, and then return it to recipe mode.
What all different system components can be brought together to send user alerts on different mediums (push notification, whatsapp, email, message)?
Instruction
- Please create a component level diagram to discussion the solution design
- Solution should be low latency, fault-tolerance and distributed in nature. It can be easily scaled to serve millions of monthly alerts to users.
- Data modeling diagram to represent how things are connected to each other and how data is flowing.
- Trade Off decisions should be highlighted.
Questions
- size of data?
- Rate of stream? - 10K per second
Solution
- Alert mapping table (in memory or redis)
- Subscribe to mqtt topics
- Log to alerts too - rdms
- Async processing
- Better processing
- Kafka streams
- Apache Pulsar
- Druid
- Consumer Lag
Architecture
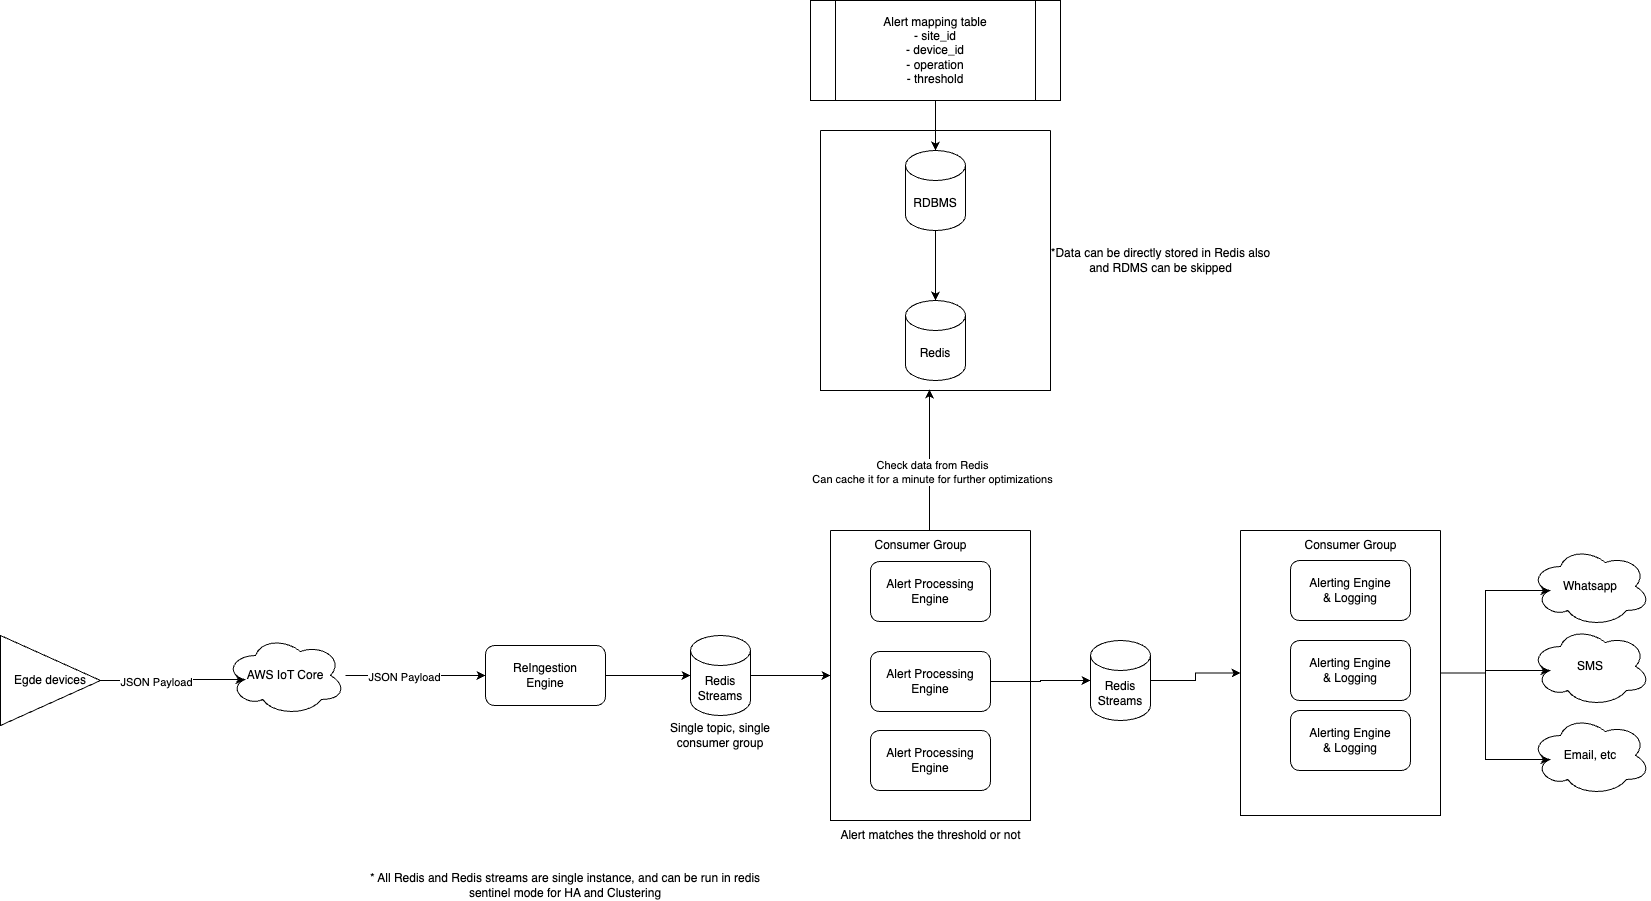
- Alert mapping table - Main copy in RDBMS
- Pushed copy in redis
- Updates pushed to redis from RDMS whenever changed
- Backend service - mqtt broker to redis streams conversion for creating consumer group
- Redis streams (single topic)
- Backend service - alert processing module
- Process the packet
- match it with alert mapping table
- push to redis streams communication channel
- Backend service - alerting engine
- Log the incoming alert
- Call the communications api (based on alert mapping, or alert processing module can send the channel too)
- SMS
- Push
- Telegram, etc
- Can send multiple customers
- Webhook for delivery status
- Scaling ways
- Multithreading
- Asyncio
- Horizontal Scaling
Followups
- Duplicate
- Automatic resolutions
- Fire forget
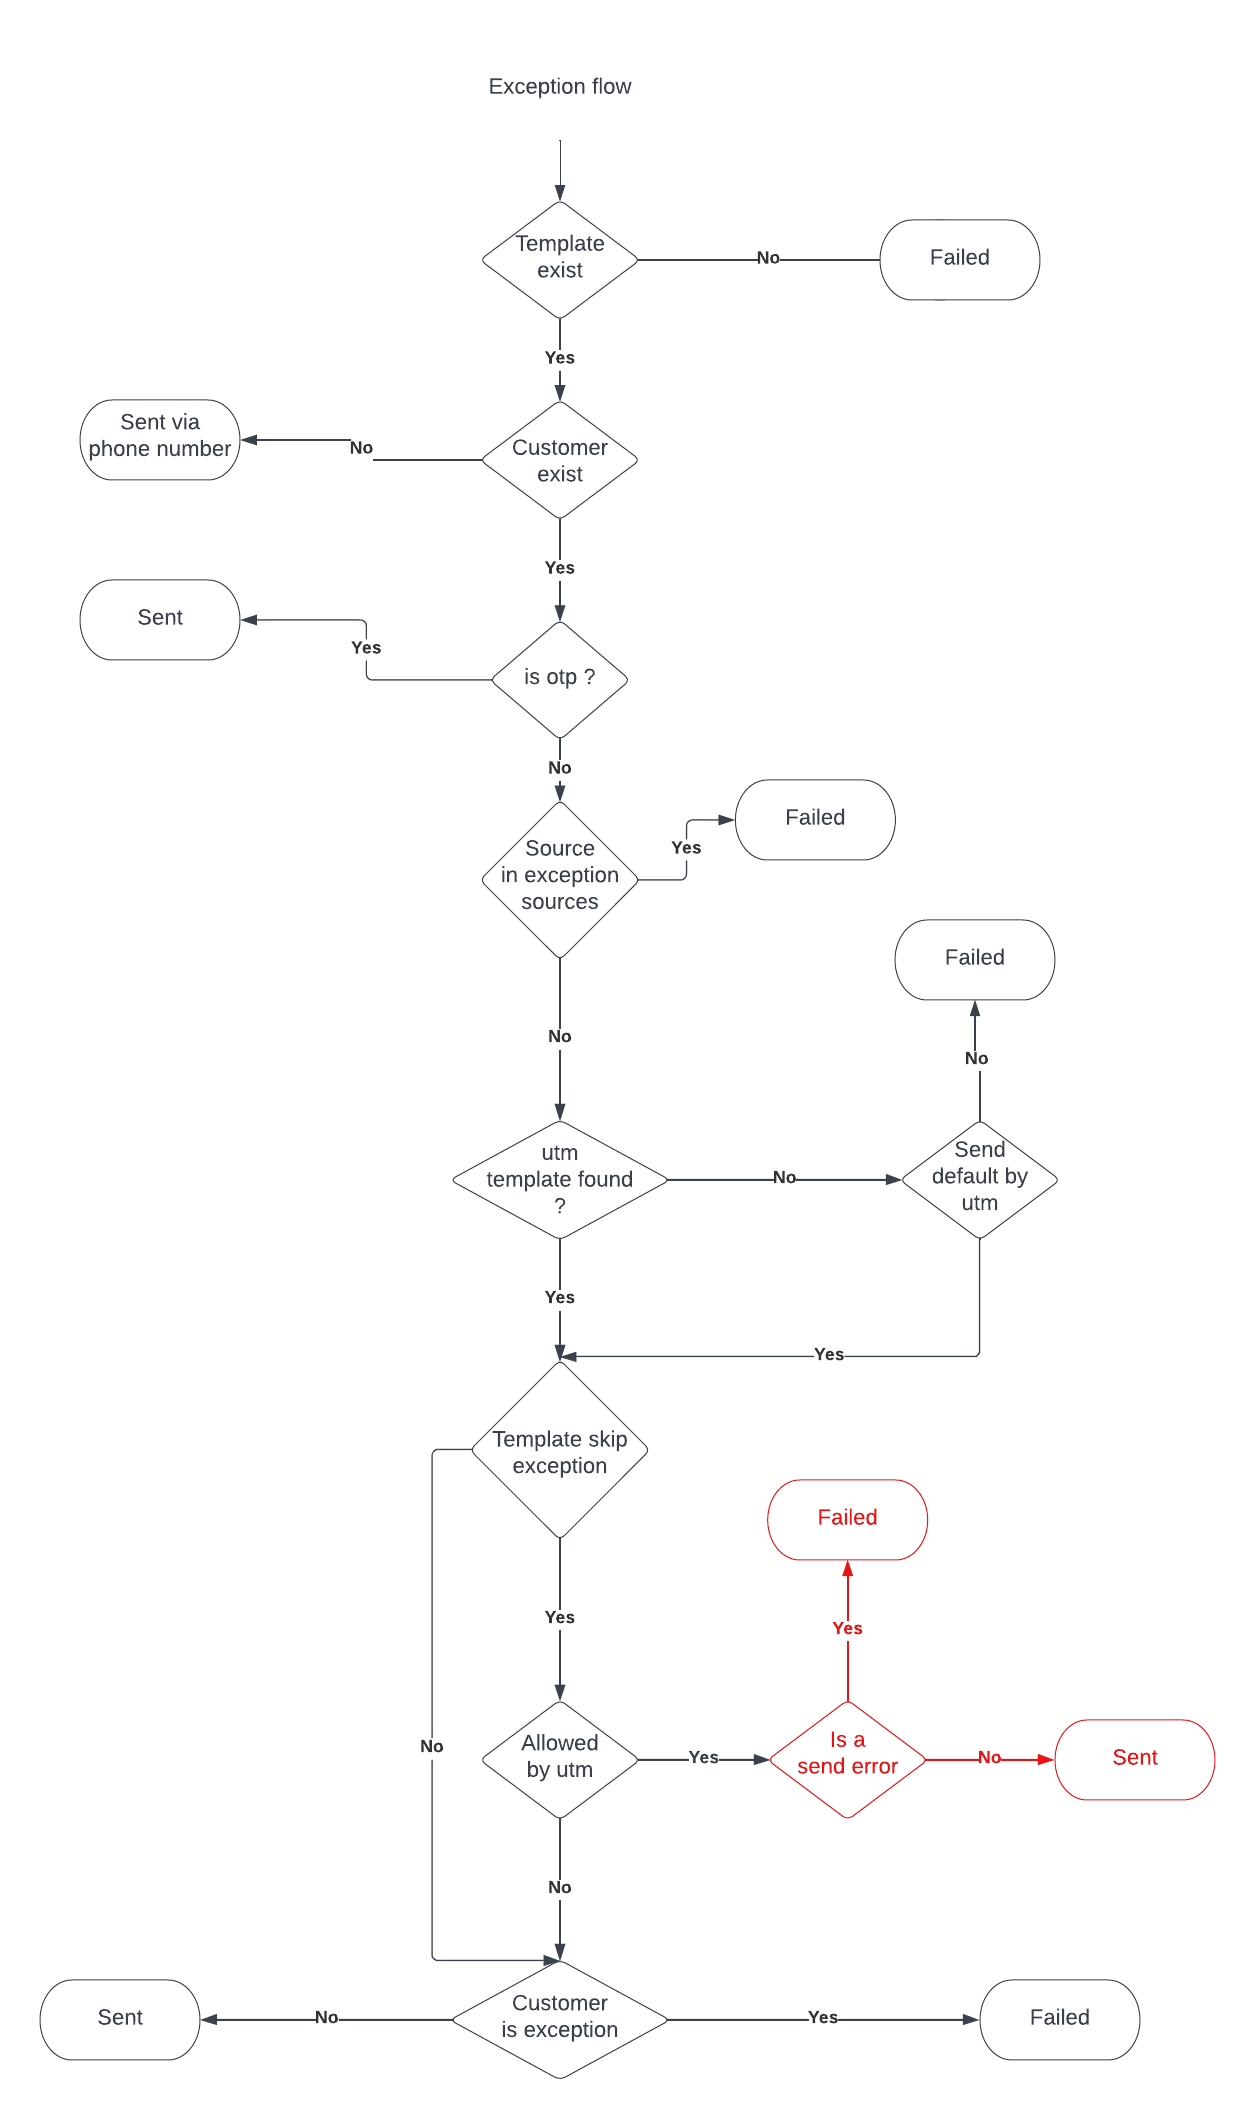
Alerting Exceptions Handling