Case Study: Anomaly Detection in Metric Data using Isolation Forest
Introduction
In the realm of data analytics, detecting anomalies is crucial for maintaining the integrity of datasets and ensuring accurate predictions. Anomalies, or outliers, are data points that deviate significantly from the majority of the data and can indicate critical issues such as errors, fraud, or changes in a process. This case study demonstrates the application of Isolation Forest, an unsupervised machine learning algorithm, to detect anomalies in metric data.
Objectives
The primary objective of this project was to identify anomalies in two datasets:
- Dataset 1: A general dataset with timestamps and values.
- Dataset 2: A metric analysis dataset specifically designed for canary analysis.
By detecting anomalies in these datasets, the goal was to ensure data integrity and highlight potential issues in the metrics being analyzed.
Methodology
Data Preparation
1. Loading and Cleaning Data
- Dataset 1: Loaded from dataset.csv, containing timestamp and value columns.
- Dataset 2: Loaded from canary_analysis_template.csv and metric.csv, containing metric_analysis_data, created_at, and canary_analysis_task_instance_id.
2. Feature Engineering
- Created time-based features such as hour, minute, quarter, month, year, dayofyear, and dayofweek from the timestamp.
- For Dataset 2, additional features like status, canary_metric_value, baseline_metric_value, and a calculated value (percentage change) were extracted from the JSON-formatted metric_analysis_data.
Anomaly Detection Using Isolation Forest
Isolation Forest is an unsupervised machine learning algorithm particularly effective for anomaly detection. It works by isolating observations by randomly selecting a feature and then randomly selecting a split value between the maximum and minimum values of the selected feature.
Model Training
- Dataset 1: Trained the model using features value, hour, minute, and day.
- Dataset 2: Trained the model using features canary_metric_value, baseline_metric_value, value, and minute.
Model Evaluation
- Predicted anomalies in both datasets and scored the observations based on their anomaly scores.
Visualization
Visualized the results using Matplotlib and created interactive plots with Plotly for detailed analysis.
Results
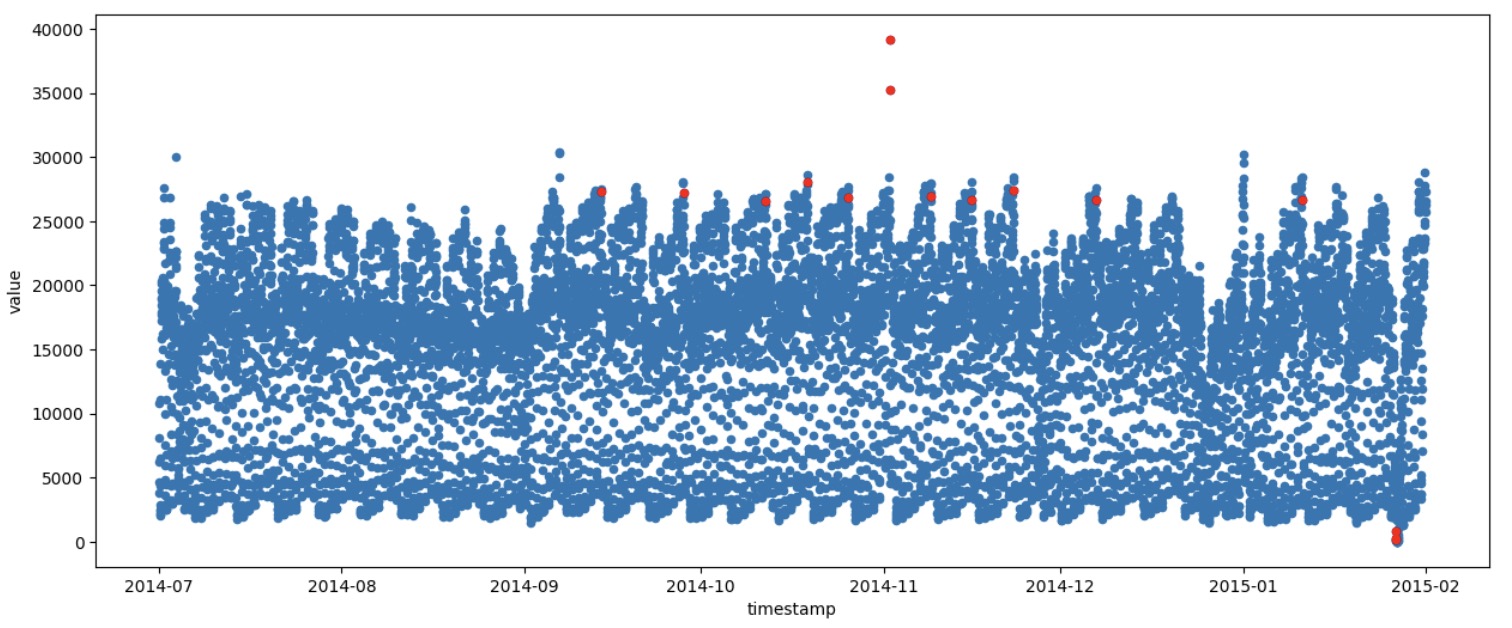
Dataset 1
- Anomalies were detected in the general dataset, with specific points highlighted as potential outliers.
- Visualization helped in identifying the timestamp and value of anomalous points.
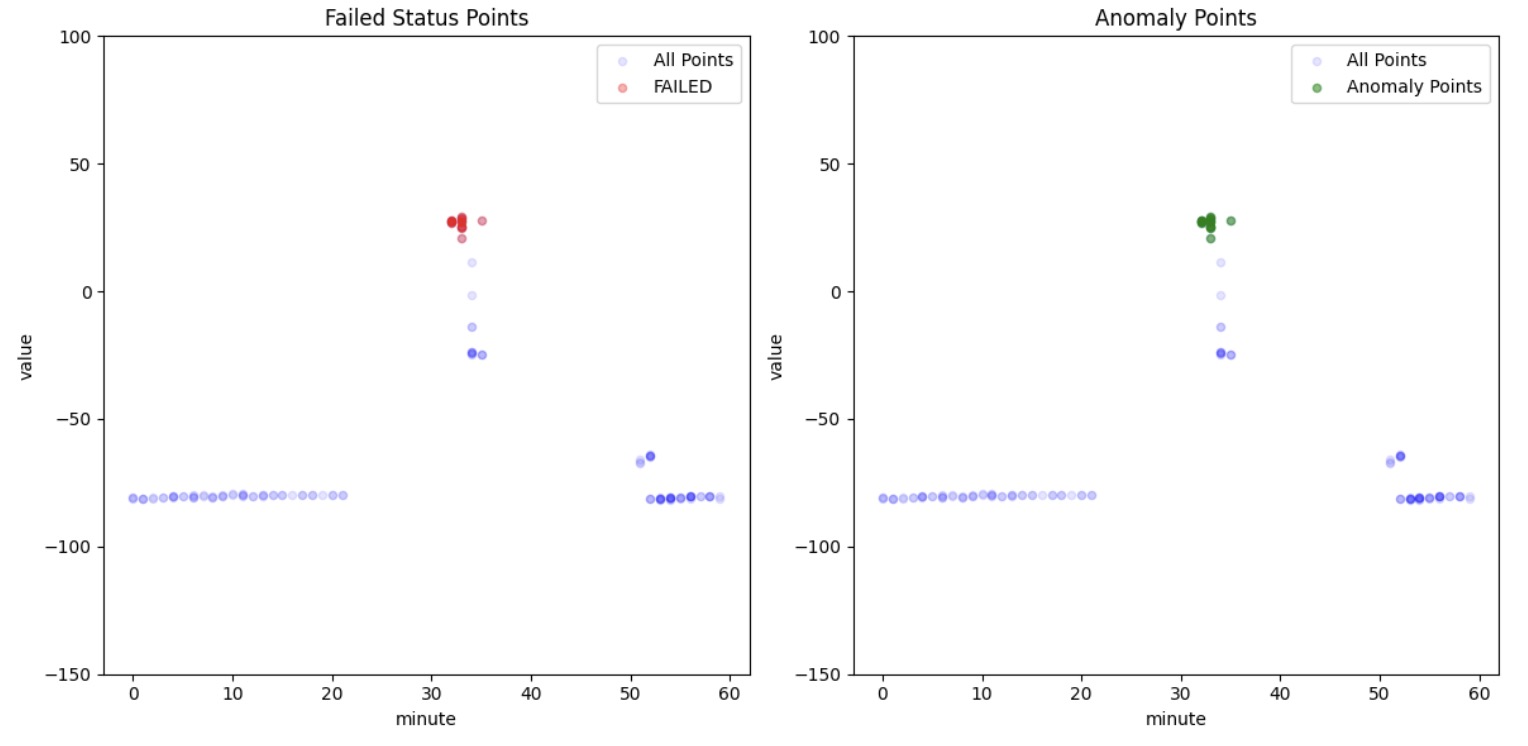
Dataset 2
- Successfully detected anomalies in the canary analysis dataset.
- Differentiated between general anomalies and those specifically associated with a "FAILED" status.
- Provided clear visual distinction between normal and anomalous data points.
Conclusion
The application of Isolation Forest for anomaly detection proved effective in identifying outliers in both general and specific metric datasets. This project showcased the use of AI/ML techniques to solve real-world problems by ensuring data integrity and highlighting potential issues through anomaly detection.
Key Takeaways
- Feature Engineering: Creating meaningful features from raw data is crucial for the success of machine learning models.
- Isolation Forest: An effective tool for unsupervised anomaly detection, capable of handling complex datasets with multiple features.
- Visualization: Essential for interpreting model results and communicating findings clearly.
This case study demonstrates the practical application of AI/ML in anomaly detection, showcasing the ability to process and analyze large datasets, extract valuable insights, and ensure the reliability of metric data.
Leveraging AI for efficient incident response - Engineering at Meta