Valuation Metrics
4 Most Popular Valuation Metrics That Every Investor Must Know | ET Money
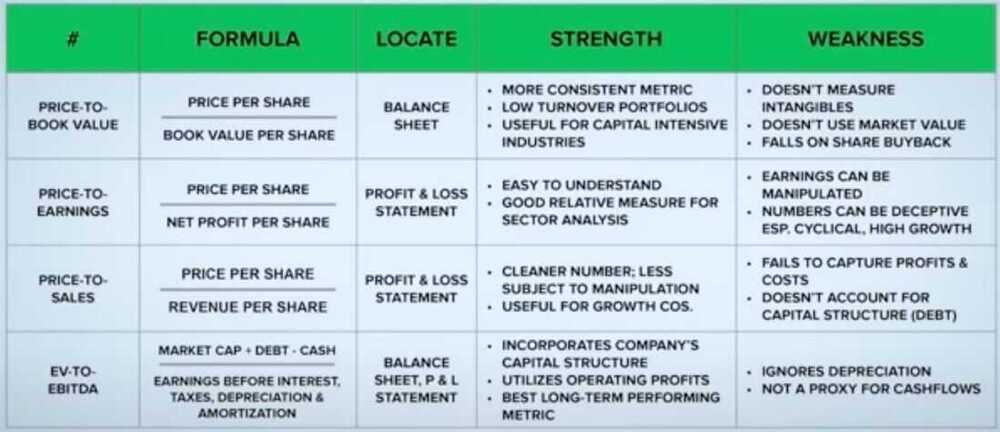
- Price to Book Ratio
- Price to Earnings Ratio
- Price to Sales Ratio
- EV to EBITDA
The invisible threat to portfolio performance | Time correction - YouTube
- Time correction
- Price correction
- Price stagnation
Macroeconomic Indicators
- m-cap-to-GDP ratio - Sensex, Nifty: Red flag! This Warren Buffett's indicator suggests stock market still is expensive
Multiple ratios can be combined to choose companies
- PB Ratio < 2, and PE Ratio < 15
- EV-to-EBITDA Ratio < 10 and PS Ratio < 5
EBITDA
Earnings before interest, tax, depreciation and amortization (EBITDA) is a measure of a company's operating performance/profitability (i.e., how much profit it makes with its present assets and its operations on the products it produces and sells, as well as providing a proxy for cash flow). Essentially, it's a way to evaluate a company's performance without having to factor in financing decisions, accounting decisions or tax environments.
https://en.wikipedia.org/wiki/Earnings_before_interest,_taxes,_depreciation,_and_amortization
Price to Book Ratio (P/B Ratio / PB Ratio)
Total amount of money a company can generate if it were to be liquidated
Book Value = Total Assets - Intangible Assets - Liabilities
Book Value = Shareholder's common equity - Preferred stock
P/B Ratio = Current price per share / Book value per share
Good for low turnover portfolio
Cons
- Doesn't take intangible assets into account
- Keeps assets at acquisition value & not at market value
- Doesn't factor in profits, sales & growth
- Penalizes good capital allocation decision at times
Price-to-Book (P/B) Ratio: Meaning, Formula, and Example
Price to Earnings Ratio (P/E Ratio / PE Ratio)
The price-to-earnings ratio (P/E ratio) is the ratio for valuing a company that measures its current share price relative to its per-share earnings (EPS). The price-to-earnings ratio is also sometimes known as the price multiple or the earnings multiple.
P/E ratios are used by investors and analysts to determine the relative value of a company's shares in an apples-to-apples comparison. It can also be used to compare a company against its own historical record or to compare aggregate markets against one another or over time.
PE Ratio = Current Price Per Share / Earnings Per Share = 200/8 = 25
Earnings per share
- Last completed FY earnings (annual report)
- 12 months training basis (net profit earned last 4 quarters)
- Equity analysts (forward pe ratio)
- Averaging (last 5-6 years of earnings)
Pros
- Simple to understand
- Factors in profitability
- Excellent relative comparison measure
Cons
- Potential manipulation of earnings
- Can hide company's true worth
- Misleading impression regarding cyclical stocks
KEY TAKEAWAYS
- The price-earnings ratio (P/E ratio) relates a company's share price to its earnings per share.
- A high P/E ratio could mean that a company's stock is over-valued, or else that investors are expecting high growth rates in the future.
- Companies that have no earnings or that are losing money do not have a P/E ratio since there is nothing to put in the denominator.
- Two kinds of P/E ratios, forward and trailing P/E, are used in practice
https://www.investopedia.com/terms/p/price-earningsratio.asp
Why the PE of One is Mohnish Pabrai’s Best Investing Strategy? PE Ratio Valuation with Example
United States Stock Market: current P/E Ratio
youtube.com/channel/UCxv9T8da7658T9R8LQT_3PQ/community?lb=Ugkx60dRH_5bruxDYiF_cm-AFUZmBCttiKX4
PEG Ratio
The price/earnings to growth ratio (PEG ratio) is a stock's price-to-earnings (P/E) ratio divided by the growth rate of its earnings for a specified time period.
- The PEG ratio enhances the P/E ratio by adding in expected earnings growth into the calculation.
- The PEG ratio is considered to be an indicator of a stock's true value, and similar to the P/E ratio, a lower PEG may indicate that a stock is undervalued.
- The PEG for a given company may differ significantly from one reported source to another, depending on which growth estimate is used in the calculation, such as one-year or three-year projected growth.
https://www.investopedia.com/terms/p/pegratio.asp
https://www.investopedia.com/investing/use-pe-ratio-and-peg-to-tell-stocks-future
Price to Sales Ratio (PS Ratio)
PS Ratio = Current Market Capitalization / Total Revenue (Sales)
Total Revenue (Sales)
- Last financial year sales
- Trailing 12 months sales
- Forward 12 months (projected sales)
- Average sales (last 5 years)
- Comes in handy when examining companies in cyclical industries
- PS Ratio is not as subjective to manipulation as PE ratio
Cons
- Does not consider debt
EV to EBITDA Ratio
EV - Enterprise Value
EV = Market Capitalization + Debt - Cash
Pros
- Incorporates company's capital structure in its entirely
- Uses the operating profits
- Best long-term performing metric
Cons
- Ignores depreciation
Graham Number
The Graham number or Benjamin Graham number is a figure used in securities investing that measures a stock's so-called fair value. Named after Benjamin Graham, the founder of value investing, the Graham number can be calculated as follows:

The final number is, theoretically, the maximum price that a defensive investor should pay for the given stock. Put another way, a stock priced below the Graham Number would be considered a good value, if it also meets a number of other criteria.
https://en.wikipedia.org/wiki/Graham_number
8 Valuation Techniques for Beginners incl. Discounted Cash Flow | How to Value a Business?
- Cost Based Valuation
- Comparable Company Valuation
- Book Value
- Revenue Multiplier
- Earnings Multiplier
- Discounted Cash Flow Model
- Intangible Assets
- Liquidation Value
Value Driver
- Revenue Growth
- Operating Margin
- Capital Ratio
- Cost of Capital