Intro
What is Product Analytics? Your Ultimate Guide | FullStory
Fundamental marketing theory
- STP - Segmentation, Targeting, Positioning
- Marketing mix
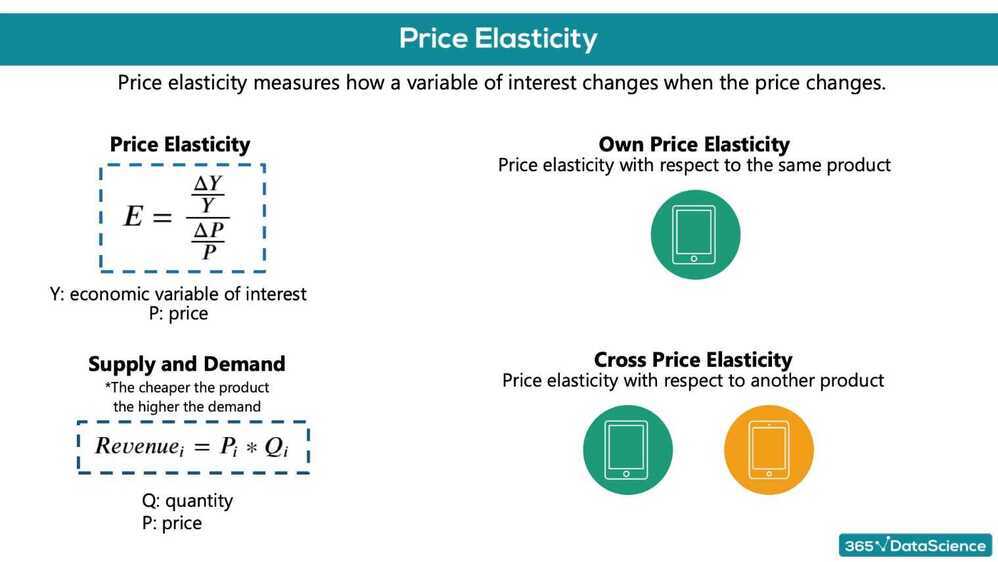
- Price elasticity
- Neural networks
Customer Analytics
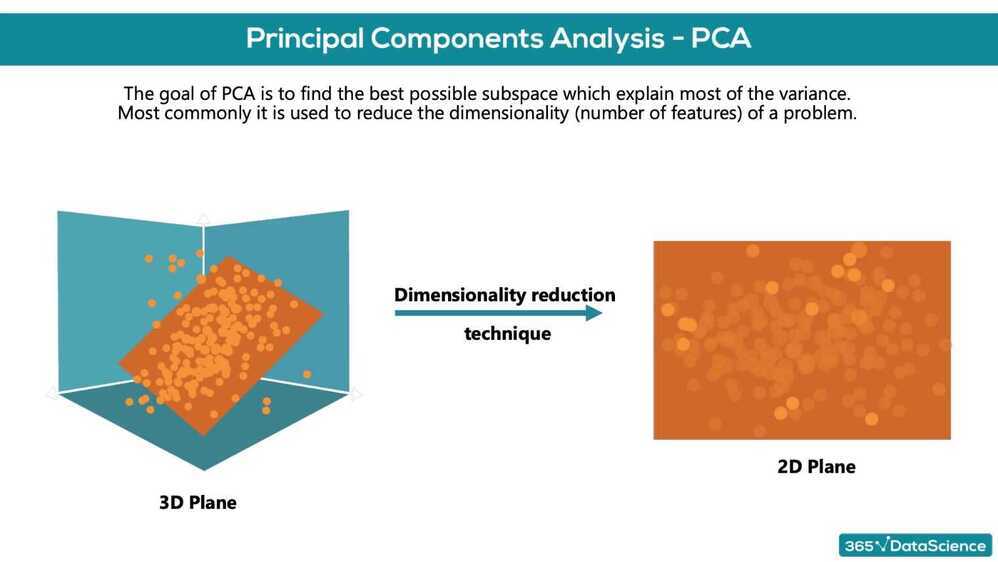
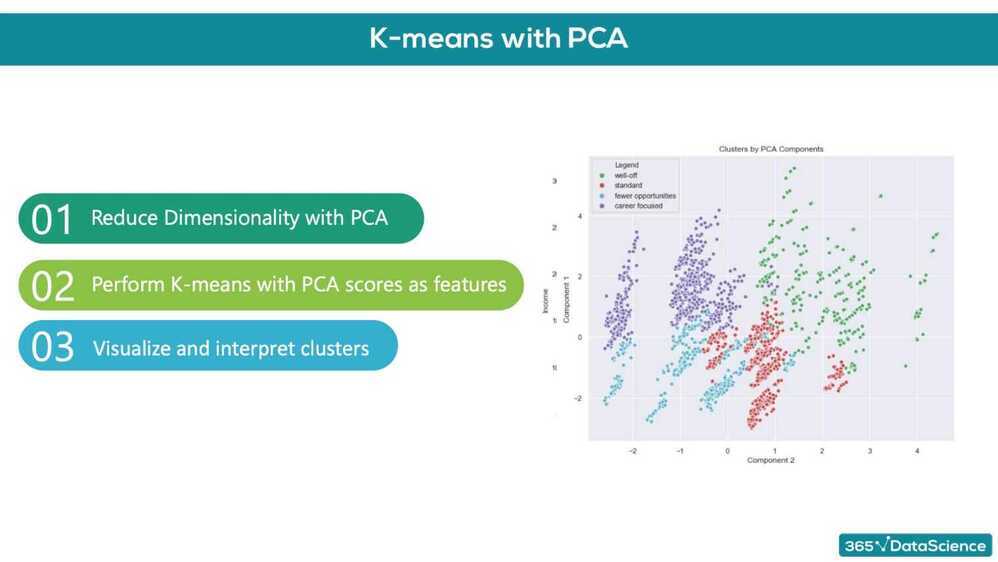
The first part of the course focuses on how to perform customer segmentation, using a hands-on approach. It involves the application of hierarchical and flat clustering techniques for dividing customers into groups. It also features applying the PCA to reduce the dimensionality of the problem, as well as combining PCA and K-means for an even more professional customer segmentation
Purchase Analytics
The second part of the course explores both the descriptive and predictive analysis of the purchase behavior of customers, including models for purchase incidence, branch choice, and purchase quantity. Not only that, but it also covers the application of state-of-the-art deep learning techniques to make predictions using real-world data
STP Framework
STP is a fundamental marketing framework. It can be applied to all areas of business and marketing activities
- Segmentation
- Targeting
- Positioning
Segmentation
-
The process of dividing a population of customers into groups that share similar characteristics
-
Observations within the same group would have comparable purchasing behavior
-
Observations within the same group would respond similarly to different marketing activities
-
Divide customers into segments based on age, income, gender
-
Consumer data
- Demographic
- Geographic
- Psychographic
- Behavioral
- Purchase frequency
- Time of purchase
- Purchase quantity
- Product ratings
Targeting
-
The process of evaluating potential profits from each segment and deciding which segments to focus on
-
Selecting ways to promote your products. You can target one segment on TV and another online
-
Examining customers' perception. (Involves psychology and usually budget constraints)
-
Consideration factors
- Segment size
- Expected growth
- Competitors' offerings
Positioning
- What product characteristics do the customers from a certain segment need?
- Shows how a product should be presented to the customers and through what channel
- In fact, this process is so important, that it has a framework of its own called: Marketing Mix
Marketing Mix
Develop the best product or service and offer it at the right price through the right channels
- Purchase probability
- Brand choice probability
- Purchase quantity
4 Ps of Marketing
- Product
- Product features; Branding; Packaging
- Price
- Product cost; Long term price changes
- Promotion
- Price reduction, display and feature
- Place
- Distribution: intensive, selective, exclusive
Physical and Online Retailers
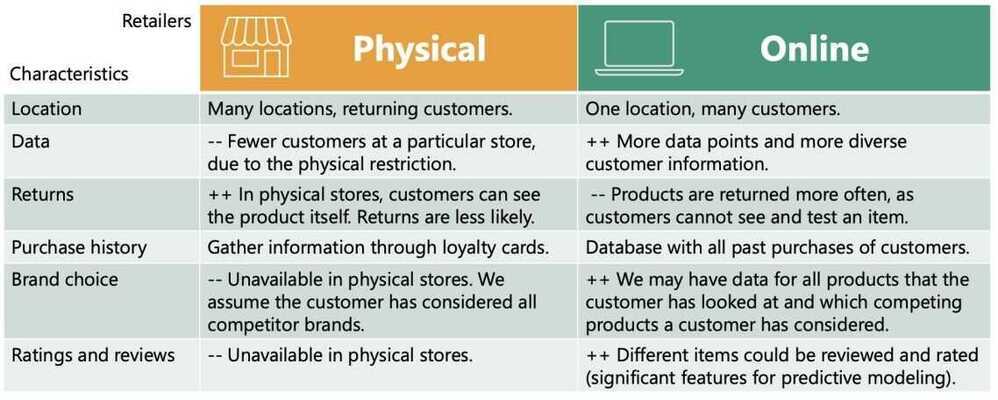
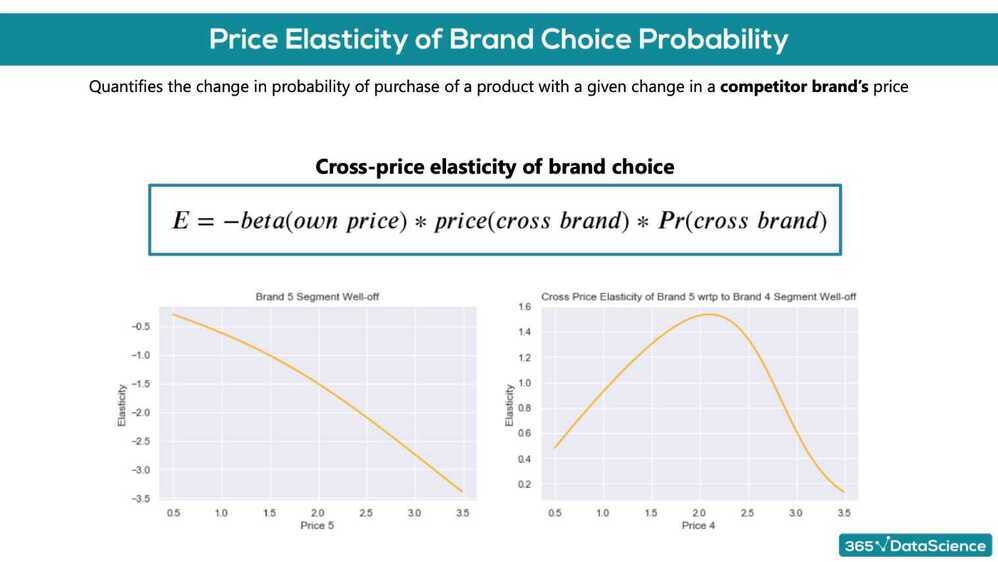
Price elasticity is: the percentage change in an economic outcome of interest with respect to one percent change in a respective price
It is expected that: units sold from a brand would increase if the unit price of the brand decreases and would increase if the unit price of a competitor brand increases
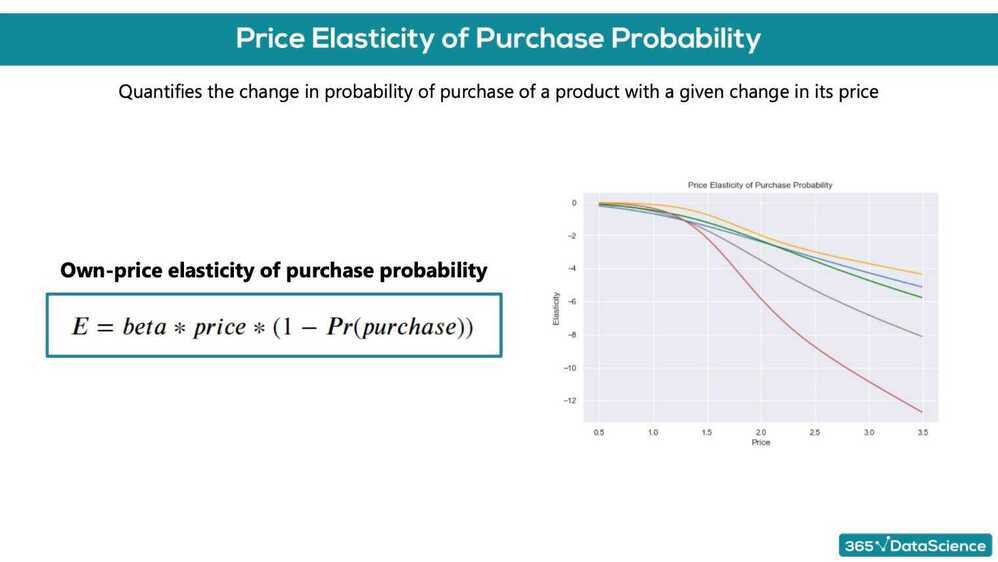
- Price elasticity of purchase probability
- Price elasticity of brand choice probability
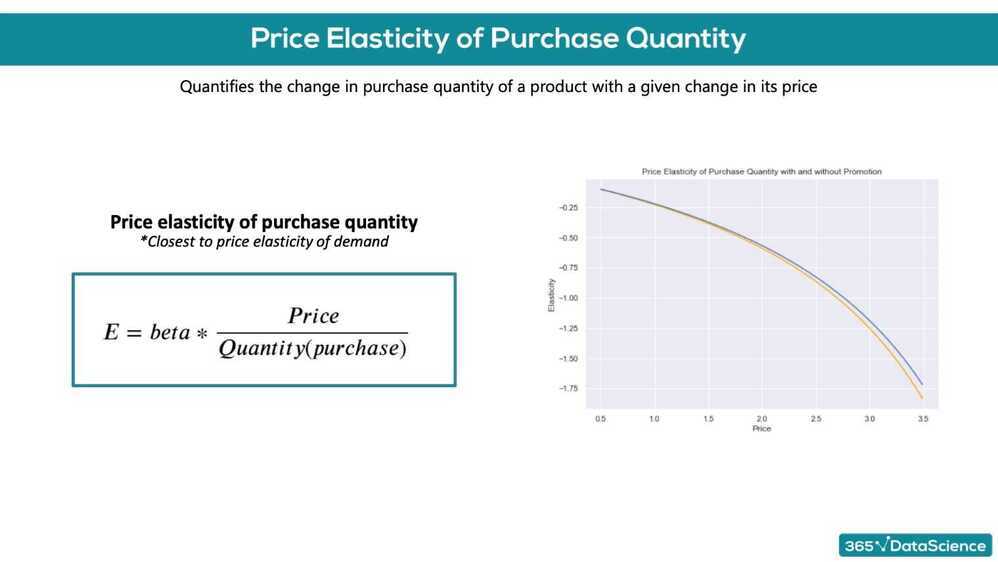
- Price elasticity of purchase quantity
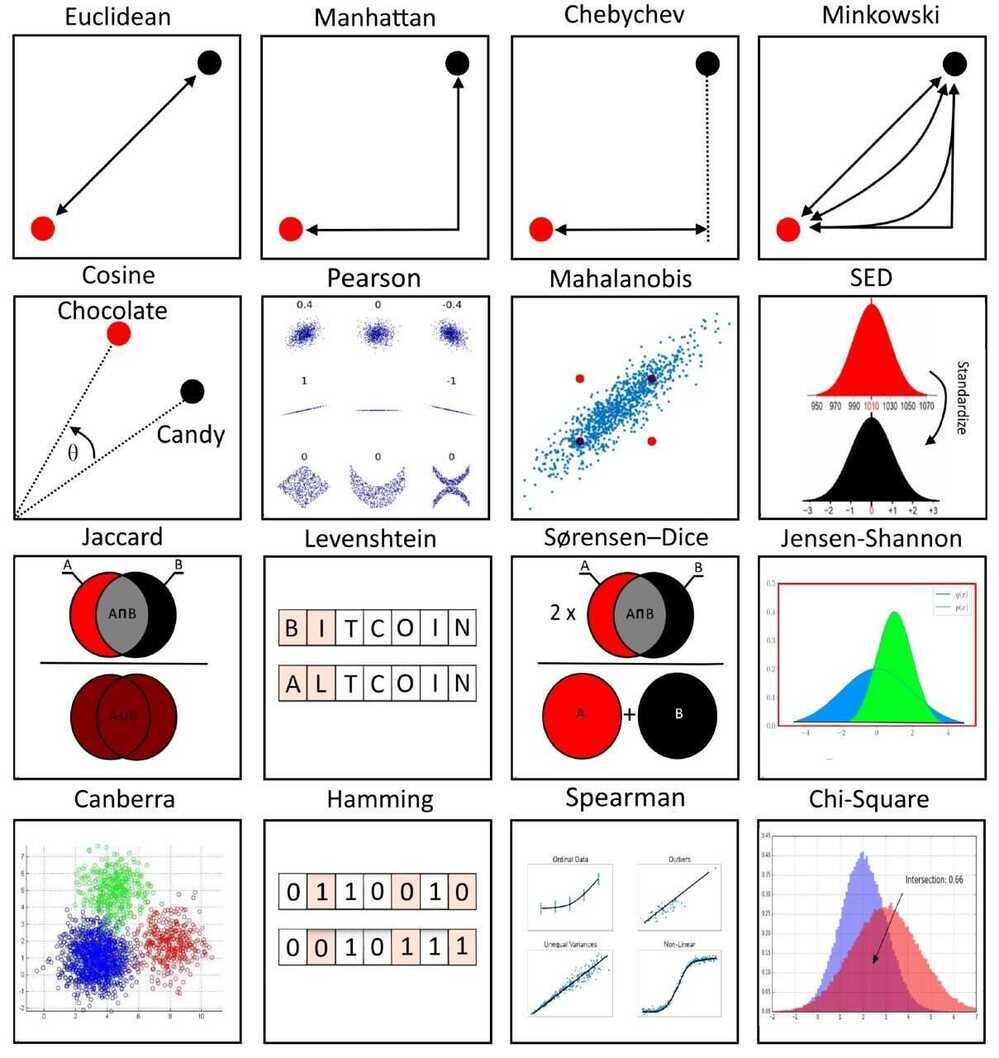
Pearson Correlation
- Linear dependency between variables
df_segmentation.corr()
- Ranges from -1 to 1
Standardization
For standardizing features. We'll use the StandardScaler module
# For standardizing features. We'll use the StandardScaler module.
from sklearn.preprocessing import StandardScaler

# Standardizing data, so that all features have equal weight. This is important for modelling.
# Otherwise, in our case Income would be considered much more important than Education for Instance.
# We do not know if this is the case, so we would not like to introduce it to our model.
# This is what is also refered to as bias.
scaler = StandardScaler()
segmentation_std = scaler.fit_transform(df_segmentation)
Types of Clustering
- Hierarchical
- Flat
- Flat clustering are way faster than hierarchical
Hierarchical Clustering
- Ex - Taxonomy of Animal kingdom
- Types of Hierarchical clustering
- Divisive (Top down)
- Agglomerative (Bottom up) (easier to solve mathematically)
- Should reach same results
- How do we measure the distances between observations?
- Euclidean distance
- Manhattan distance
- Maximum distance
- Segmentation between clusters
- Ward method (|A-B|^2)/n
scale
- Ward method (|A-B|^2)/n
# Hierarchical clustering with the Sci Py library. We'll use the dendrogram and linkage modules.
from scipy.cluster.hierarchy import dendrogram, linkage

# Perform Hierarchical Clustering. The results are returned as a linkage matrix.
hier_clust = linkage(segmentation_std, method = 'ward')

# We plot the results from the Hierarchical Clustering using a Dendrogram.
# We truncate the dendrogram for better readability. The level p shows only the last p merged clusters
# We also omit showing the labels for each point.
plt.figure(figsize = (12,9))
plt.title('Hierarchical Clustering Dendrogram')
plt.xlabel('Observations')
plt.ylabel('Distance')
dendrogram(hier_clust,
            truncate_mode = 'level',
            p = 5,
            show_leaf_counts = False,
            no_labels = True)
plt.show()
Finding a cluster
- We need to find a horizontal line on the dendogram on which to cut
- Rule of thumb: We find the longest vertical line unintercepted by a horizontal line from the dendrogram. This is where we should make the cut
K-means Clustering
- Most commonly used method in clustering because of its simplicity
- K-means is perfect for segmentation data
-
Choose the number of clusters we want to identify. K in K-means means number of clusters
-
Specify cluster seeds
- Based on Euclidean squared distance add points to one of the cluster
-
Calculate the centroid (geometrical center)
-
Repeat until the centroids stop changing
Problems
- The squared Euclidean distance is quite sensitive to outliers (solved by k-median clustering)
- Choose number of clusters before hand
- K-means enforces spherical clusters
How to Scale K-Means Clustering with just ClickHouse SQL
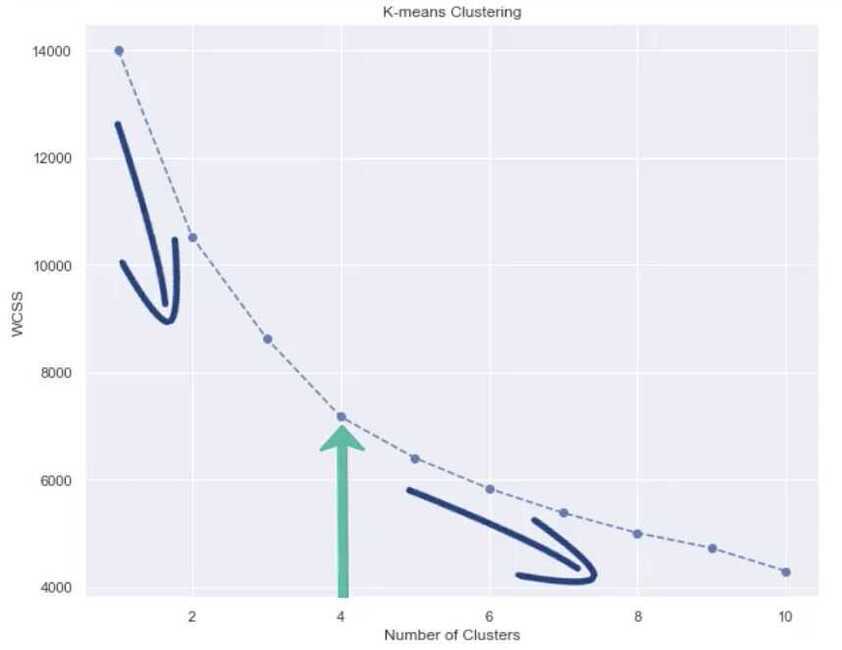
Within Cluster Sum of Squares (WCSS) is used to determine best clustering solution
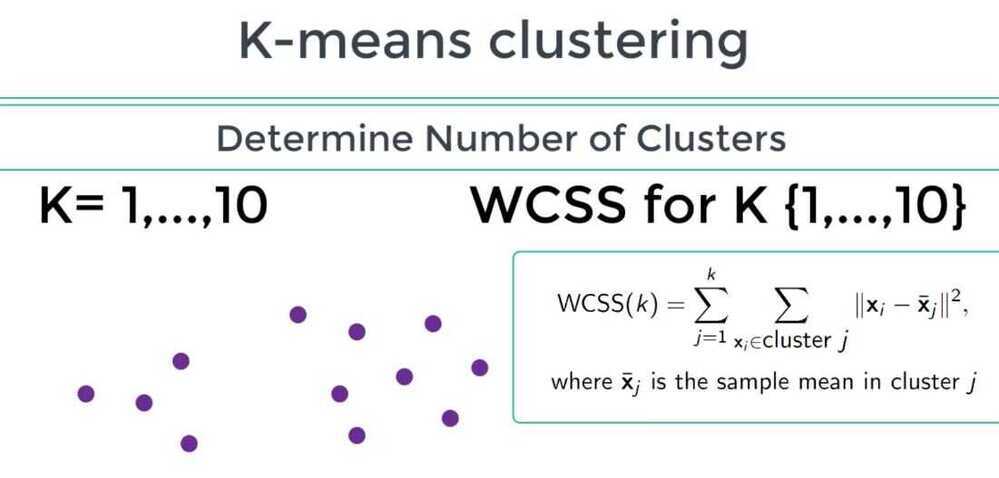
Choosing number of clusters - Elbow method
Purchase Analytics
Price elasticity of purchase probability
% change in purchase probability in response to a 1% change in price
We have a product, which costs $2.40-. We have obtained the price elasticity of purchase probability to be -0.79. The customer at this price point is: inelastic
We have a product, which costs $3.50. We have obtained the price elasticity of purchase probability to be -2.1. The customer at this point is: elastic
We have a product, which costs $2.00. Using a logistic regression model, we have obtained the coefficient for price to be -2.3. In addition, we have estimated the purchase probability at this price point to be 0.3. Using the price elasticity formula from the lecture, what is the price elasticity? -3.22
A company has a product with a price of 2.3 dollars on the market. They have estimated that the price elasticity of purchase probability at this price point is -0.9. If you are an adviser for the marketing team of the company what would you recommend: The company should increase the price of the product, without fear of losing too many customers.
The purchase probability of a client at a price point is 0.7, while their price elasticity: -1.56. If we raise the price of the product by 1%, the new probability of purchase of the client will be: 68.44%
The purchase probability of a client at $2.56 is 0.7, while their price elasticity: -1.22. If we lower the price of the product by $0.02, the new probability of purchase of the client will be: 70.95%
Multnomial Logistic Regression - For a multiclass scenario
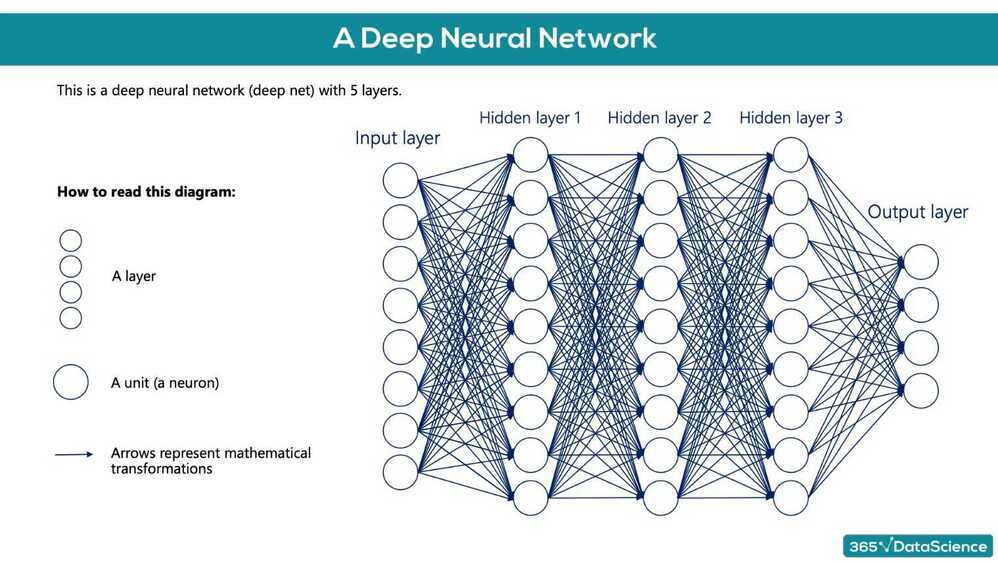
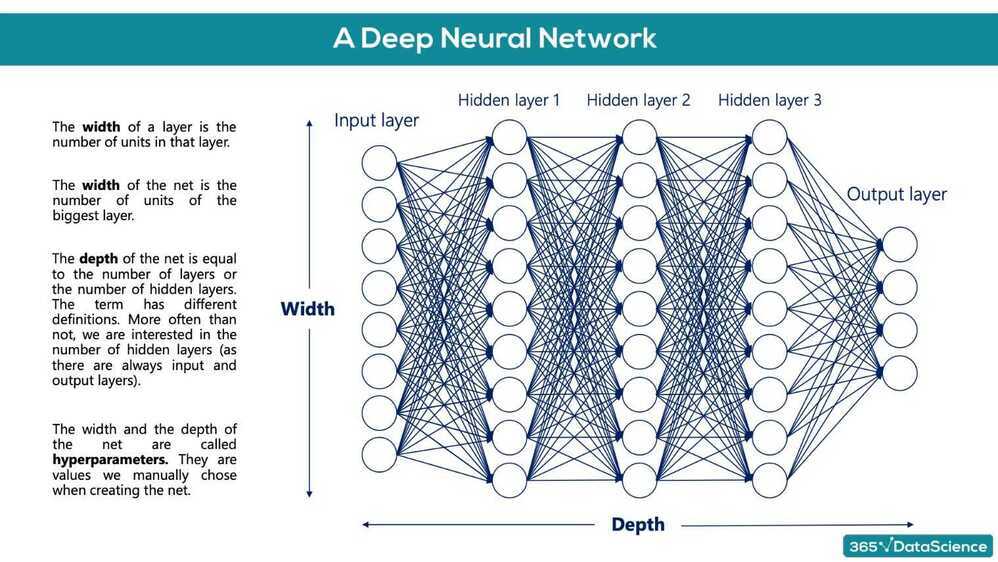
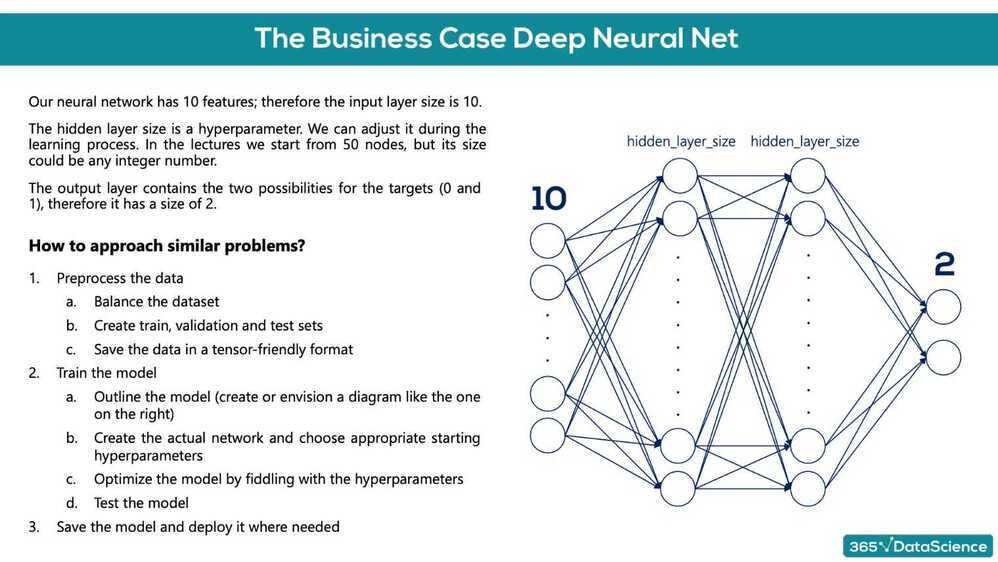
Deep Learning
Training the deep learning model
- Keras was built into the core TensorFlow, so most TensorFlow 2.0 methods are not referenced as 'TensorFlow', but rather Keras methods
- tf.keras.Sequential(layers) function that is laying down the model (used to 'stack layers')
- tf.keras.layers.Dense(output layer size, activation function) takes the inputs provided from the last layer, calculates their dot product with the weights and adds the bias. Also applies an activation function.
- Activation functions
- relu
- sigmoid
- tanh
- softmax
- model.compile(optimizer, loss) configures the model for training
- Optimizers
- Adaptive Moment Estimation (ADAM)
- loss
- sparse_categorical_crossentropy
- applies one-hot encoding to the targets
- sparse_categorical_crossentropy
- Optimizers
- tf.keras.callbacks.EarlyStopping(patience) ensures that the model stops traning after the validation loss has started increasing. When patience=0, it will stop after the first validation increase. patience = 2
- fit()
- evaluate() returns the loss value and metrics values for the model in 'test mode'
- predict()
- argmax - Arguments of the maxima