Microsoft Excel / Google Sheets
Do Something .new | A Domain Exclusively for Shortcuts
Features
- Timeline View - https://support.google.com/docs/answer/12935277 https://www.youtube.com/watch?v=Vl0H-qTclOg&feature=youtu.be&ab_channel=freeCodeCamp.org
- enter data
- navigate through a spreadsheet
- create formulas to solve problems
- create charts and graphs
- understand relative vs absolute references
- import and export data
- implement VLOOKUP
- use pivot tables
- split and concatenate text
Columns - 16,384
Rows - 1,048,576- Text to column
- Pivot Tables
- Preferences > View > Developer Tab in the Ribbon (For macros)
- Fix cells (Absolute and Relative Cells, use dollar as prefix or postfix in functions for addresses of cells)
- Select special
- Dynamic names (="P&L:"&C4)
- Named cell ranges
- Dropdown menu (Data validation)
- Conditional Formatting
- Custom cell formatting
Shortcuts
gsheet
cmd + opt + =- Insert 1 row above / Insert 1 column left based on selection (either row or column or cell)cmd + opt + -- Delete the selected rowcmd + shift + fn + up/down- switch between sheets
excel
- cmd + fn + up/down - move between sheets
- fn + f4 - locking the cell
- fn + f2 - edit the cell
ctrl + ;- paste today's date in cell- ctrl + 1 - open format box
- ctrl + cmd + v - open paste special dialog box
- t - paste format
- ctrl + shift + l = add filter to data tables
- cmd + delete = scroll to active cell
Examples / Functions
-
IF(A4>$B$1,B4,C4)IF(A4>$B$1,IF(B4>$C$2,B4,C4),C4)IF(OR(A4<$B$1,B4<$C$2),C4,B4)IF(AND(A4<$B$1,B4<$C$2),C4,B4)IF(D7>=96,"A",IF(D7>=86,"B",IF(D7>=76,"C",IF(D7>=61,"D",IF(D7>=51,"E", "F")))))
-
SUMIF(C6:C15,D19,D6:D15)SUMIF($C:$C, "Revenue", D:D)
-
AVERAGEIF(B5:B11,"<"&300000,C5:C11) -
FORECAST(B10,C2:C8,B2:B8) -
SUMPRODUCT(B5:B7,C5:C7)/SUM(B5:B7) -
MID(B4,1,10) -
IRR(B4:B8) -
XIRR(B5:B9,C5:C9) -
YEAR(B4) -
MONTH(B4) -
DAY(B4) -
TODAY() -
EOMONTH(B10,3) -
EOMONTH(B10,-3) -
IFERROR(SUM(C4:C6),"NA") -
AVERAGE(C6:C11) -
MEDIAN(C6:C11) -
MAX(C6:C11) -
MIN(C6:C11) -
VLOOKUP(B10,B7:E12,3,TRUE)=VLOOKUP(search_key, range, index, [is_sorted])- VLOOKUP - Google Docs Editors Help
-
IF(ISNUMBER(MATCH(A2, Sheet2!C:C, 0)), 1, 0) -
IFERROR(VLOOKUP(A2, Sheet12!A:B, 2, FALSE), F2) -
PMT(D5,D6,D4)- calculate emi amount for loan -
What-if analysis
- GoalSeek
-
PERCENTILE(A2:A20, 0.5)# to get 50th percentile value -
PERCENTILERANK(A2:A20, A2)# relative position of a particular data point within a dataset expressed as a percentage -
PERCENTRANK.INC: Calculates the percentile rank of a value, including the smallest and largest values. -
PERCENTRANK.EXC: Calculates the percentile rank of a value, excluding the smallest and largest values. -
IF
- SUMIF, SUMIFS, COUNTIF, COUNTIFS
countif(AS3:AS25, "<>0")# count if not zero
-
FILTER(I:I, ISNA(MATCH(I:I, C:C, 0)))- filter one column based on other column -
concatenate(A1:A5) -
=GOOGLEFINANCE("GOOGL")
-
=GOOGLEFINANCE("BTCUSD")
-
=GOOGLEFINANCE("CURRENCY:USDINR")
-
=IMPORTDATA("https://cryptoprices.cc/SOL/")
-
=image("https://image.jpg")
Others
- Conditional Formating - Color Scales
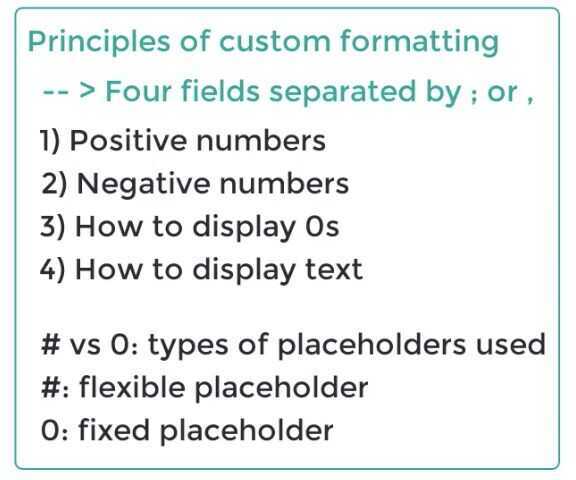
- Custom number format -
[$₹][>9999999]##\,##\,##\,##0;[$₹][>99999]##\,##\,##0;[$₹]##,##0
Microsoft Excel - Useful Tools & Tips
- How to Make Your Spreadsheets Look Professional
- Inserting, Deleting, and Modifying Rows & Columns
- Excel Formulas for Beginners
- Excel Functions
- Work Efficiently by Using Cut, Copy, and Paste
- Format Cells
- Pasting Values, Formulas and Formats with Paste Special
- Inserting a Line Break with Alt + Enter
- Do More with Your Sales Data with Excel's Text to Columns Feature
- Create Easily Printable Excel Documents
- How to Wrap Text in Excel and Adjust a Cell's Size
- Insert Hyperlinks into Excel Spreadsheets
- Using Excel's Freeze Panes to Handle Large Datasets
- Find Excel Functionalities in a Quicker Way - Tell Me What You Want to Do
- A Quick Introduction to Excel's Pivot Tables
- Initial Formatting Is Key for Creating Professional-looking Spreadsheets
- Macros Are a Great Timesaver! Here's Why
- How to Use the Same Macro On Multiple Workbooks
- The Secret to Faster Scrolling in Excel
- Be even quicker: F5 + Enter
- Using Absolute and Relative Cell References
- Find and Select Cells That Meet Specific Conditions
- How to Create Dynamic Names in Excel Spreadsheets
- Using Named Ranges to Make Formulas More Readable
- How to Add a Drop-down List in Excel
- Using Custom-sort to Sort Multiple Columns Within a Table
- Saving Time in Excel and Doing Everything Faster by Using Excel Shortcuts
- Multiply by 1
- Find and Replace - References
- Find and Replace - Formatting
- Green References
- Beauty Saving - The Professional Way of Saving Files
- The Power of F2
- Conditional Formatting
- Introduction to Custom Cell Formatting
- Custom Formatting - An example
Microsoft Excel - Beginner, Intermediate & Advanced Functions
- Key Excel Functions: If
- Enlarge the formula bar
- Key Excel Functions: Sum, Sumif, Sumifs
- Key Excel Functions: Count, Counta, Countif, Countifs
- Key Excel Functions: Average & Averageif
- Key Excel Functions: Left, Right, Mid, Upper, Lower, Proper, Concatenate, &
- Working with text in Excel
- Find the Highest and Lowest Values in a Range: Max & Min
- = and + are interchangeable when you start typing a formula
- Use Round in Your Financial Models
- Excel's Lookup Functions: Vlookup & Hlookup Made Easy
- Index, Match, and Their Combination - The Perfect Substitute for Vlookup
- Using Excel's Iferror Function to Trap Spreadsheet Errors
- A Useful Tool for Financial Analysis - The Rank Function
- Create Flexible Financial Models with Choose
- Goal Seek Will Help You Find the Result You Are Looking For
- Perform Sensitivity Analysis with Excel's Data Tables Functionality
Microsoft Excel - Practical Exercise "Build a P&L From Scratch"
- Introduction to the Case Study
- What You Will See Next
- Understand Your Data Source Before You Start Working on It
- Ordering the Source Worksheet
- Create a Code: The Best Way to Organize Your Data and Work Efficiently with It
- Learn How to Create a Database
- Using Lookup Functions (Vlookup) to Fill the Database Sheet
- Use Sumif to Complete the Database Sheet
- Using Index & Match as a Substitute for Vlookup
- The Mapping Exercise
- Mapping the Rows in the Database Sheet
- Building the Structure of the P&L Sheet
- A Practical Example of Professional Formatting in Excel
- Populate the P&L Sheet with Sumif
- Learn How to Find Mistakes with Countif
- Calculating Growth Rates in Excel
Microsoft Excel - Building Professional Charts in Excel
- Introduction to Excel Charts
- Beginner's Guide to Inserting Charts in Excel
- Modifying Excel Charts - The Easy Way
- Making Your Excel Charts Sexier - Proven Tips
- Creating a Bridge Chart in Excel 2016 - As Easy as It Gets
- New Ways to Visualize Your Data - Treemap Charts
- How to Represent Trends with Sparklines
- Stacked Column Chart with a Secondary Axis
- Doughnut Chart
- Area Chart
- Bridge Chart
Introduction to Pivot tables
- Intro to Pivot tables
- Editing a Pivot table
- Formatting a Pivot table
- Adjusting a Pivot table
- GETPIVOTDATA
- Slicers
A practical case study with Pivot Tables
- Introduction to the case study
- Working with an SAP data extraction
- Preliminary mapping of the data extraction
- Creating an output structure of the FMCG model
- Improving the layout and appearance of the FMCG report
- Inserting formulas and automating calculations
- Creating a Master Pivot Table: The main data source for the FMCG report
- GetPivotData is great! Extracting data from the Master Pivot Table
- Combining Slicers and GetPivotData: The key to our success
- Getting fancy with Excel slicers
- This is how the report can be used in practice by high-level executives
- https://365datascience.teachable.com/courses/enrolled/526364
Advanced Microsoft Excel
Proficient Excel formatting
- Why Excel and why modeling
- Let's start from scratch and create a P&L sheet
- Cell styles allows you to be faster
- Pasting values, formulas, and formats with Paste Special
- Formatting Cells Part I - Working with data in Excel
- Formatting Cells Part II - Customize numbers the way you like
- Highlight key data with Excel Conditional Formatting
- Filter by color
How to be 3.0x faster than average users
- Use multiple screens simultaneously
- F1 to F12 - Using Excel's function keys
- How to select visible cells only
- Grouping Excel rows and columns - The correct way to do it!
- Working on multiple sheets at the same time
Excel mechanics
- Find & Replace - Our favourite Excel tool
- A great way to apply Find & Replace
- What Are Circular References in Excel
- Circular References - An example
- Trace precedents - Display the relationship between formulas and cells
Not so simple Excel functions
- What is a nested function
- Advanced Excel functions Index; Match; Index & Match
- Advanced Excel functions Index, Match, Match
- Advanced Excel functions Indirect; Vlookup & Indirect
- Advanced Excel functions Rows; Columns; Vlookup & Columns
- Advanced Excel functions Vlookup & Match
- Advanced Excel functions Choose; Vlookup & Choose
- Advanced Excel functions Offset; Offset & Match
- Date functions
Excel tips & tricks
- Excel tips & tricks Part 1
- Excel tips & tricks Part 2
- Excel tips & tricks Part 3
- Excel tips & tricks Part 4
https://365datascience.teachable.com/courses/enrolled/233558

Google Drive
Set up a shared drive - Google Workspace Learning Center
22 of the Best Free Google Sheets Templates
Google Doc
Extension - Page Sizer
AppScripts
runBigQuery
// @ts-nocheck
function runBigQueryQuery() {
  const projectId = 'project-id'; // Replace with your GCP Project ID
  const sheetName = 'abc'; // Name of the sheet where results will be written
  const query = `
    SELECT
      a.id
    FROM dataset.table_name a
    WHERE a.id = "ABCD";
  `;

  // Construct the BigQuery query request
  const request = {
    query: query,
    useLegacySql: false,
  };

  // Run the query using BigQuery service
  const queryResults = BigQuery.Jobs.query(request, projectId);

  // Check if the query returned any results
  if (!queryResults || !queryResults.schema || !queryResults.rows) {
    Logger.log('No results found or query failed.');
    return;
  }

  // Get the active spreadsheet and the target sheet
  const spreadsheet = SpreadsheetApp.getActiveSpreadsheet();
  let sheet = spreadsheet.getSheetByName(sheetName);
  if (!sheet) {
    sheet = spreadsheet.insertSheet(sheetName);
  }

  // Clear the sheet before writing new data
  sheet.clear();

  // Write the query results to the sheet
  const headers = queryResults.schema.fields.map(field => field.name);
  sheet.appendRow(headers);

  queryResults.rows.forEach(row => {
    const values = row.f.map(field => field.v);
    sheet.appendRow(values);
  });

  Logger.log(`Query results written to the sheet: ${sheetName}`);
}
copyRowWithNowBeforeLatest
function copyRowWithNowBeforeLatest() {
  var sheet = SpreadsheetApp.getActiveSpreadsheet().getSheetByName("Total");
  var snapshotSheet = SpreadsheetApp.getActiveSpreadsheet().getSheetByName("Daily Snapshots");

  // Get the current date (without time)
  var currentDate = new Date();
  currentDate.setHours(0, 0, 0, 0);  // Set time to midnight for date comparison

  // Get all the data from the first column
  var data = sheet.getRange(1, 1, sheet.getLastRow(), 1).getValues();

  var rowToCopy = -1;
  var rowOfLatest = -1;

  // Iterate through the first column to find the row where the NOW() value matches and the row with "Latest"
  for (var i = 0; i < data.length; i++) {
    var cellValue = data[i][0];

    // Find the "Latest" row
    if (cellValue === "Latest") {
      rowOfLatest = i; // Row where "Latest" is found
    }

    // Check if the cell contains a date-time value
    if (cellValue instanceof Date) {
      // Strip the time part from the date to compare only the date
      var cellDate = new Date(cellValue);
      cellDate.setHours(0, 0, 0, 0);  // Set time to midnight for date comparison

      // Compare only the date part
      if (cellDate.getTime() === currentDate.getTime()) {
        rowToCopy = i + 1; // Store the row number (add 1 because array is 0-indexed, sheet is 1-indexed)
      }
    }
  }

  // If we didn't find a matching row for NOW(), log an error and return
  if (rowToCopy == -1) {
    Logger.log("No row found with a matching NOW() value.");
    return;
  }

  // If "Latest" is not found, log an error and return
  if (rowOfLatest == -1) {
    Logger.log("'Latest' not found in the first column.");
    return;
  }

  // Get the data from the matching row
  var rowData = sheet.getRange(rowToCopy, 1, 1, sheet.getLastColumn()).getValues();
  // var rowFormat = sheet.getRange(rowToCopy, 1, 1, sheet.getLastColumn()).getBackgrounds();
  var rowNumberFormats = sheet.getRange(rowToCopy, 1, 1, sheet.getLastColumn()).getNumberFormats();

  // Get the last row in the "Daily Snapshots" sheet
  // Get all the data from the first column
  var data2 = snapshotSheet.getRange(1, 1, snapshotSheet.getLastRow(), 1).getValues();

  // Iterate through the first column to find the row where the value matches "Max"
  for (var i = 0; i < data2.length; i++) {
    var cellValue = data2[i][0];

    // Find the "Latest" row
    if (cellValue === "Max") {
      lastEmptyRow = i-1; // Row where "Max" is found
    }
  }

  // Insert a new row before the "Latest" row so to keep the formatting
  snapshotSheet.insertRowBefore(lastEmptyRow);

  // Paste the copied data into the new row in "Daily Snapshots"
  snapshotSheet.getRange(lastEmptyRow, 1, 1, rowData[0].length).setValues(rowData);

  // Paste the copied data into the new row
  // sheet.getRange(rowOfLatest, 1, 1, rowData[0].length).setValues(rowData);

  // Copy the background formatting
  // sheet.getRange(rowOfLatest, 1, 1, rowFormat[0].length).setBackgrounds(rowFormat);
  snapshotSheet.getRange(lastEmptyRow, 1, 1, rowNumberFormats[0].length).setNumberFormats(rowNumberFormats);
  // snapshotSheet.getRange(lastEmptyRow, 1, 1, rowFormat[0].length).setBackgrounds(rowFormat);

  Logger.log("Row copied from row number: " + rowToCopy + " and inserted at row: " + rowOfLatest);
}