Data Preprocessing
Data Preprocessing
- Aggregation
- Attribute Transformation
- Dimensionality Reduction
- Feature creation
- Feature subset selection
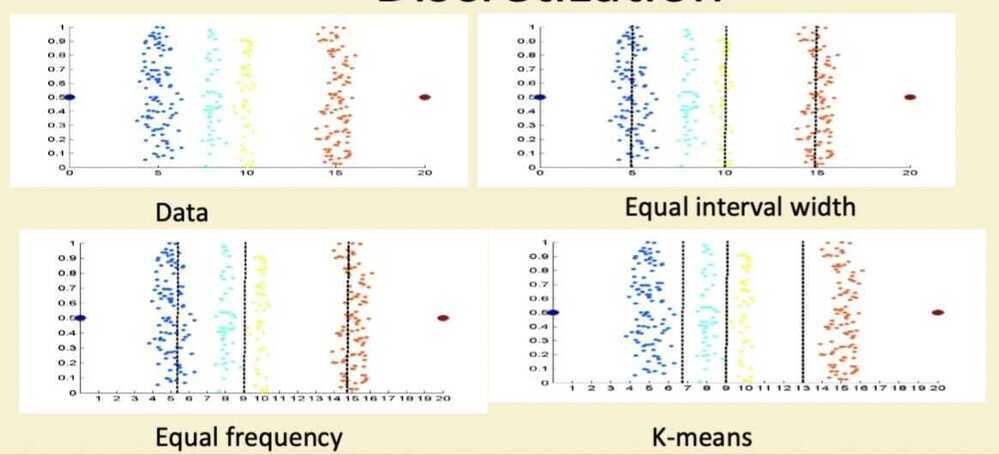
- Discretization and Binarization
- Sampling
Aggregation
- Combining two or more attributes (or objects) into a single attribute (or object)
- Purpose
- Data reduction
- Reduce the number of attributes or objects
- Change of scale
- Cities aggregated into regions, states, countries, etc
- More stable data
- Aggregated data tends to have less variability
- Data reduction
Discretization
Attribute Transformation
- A function that maps the entire set of values of a given attribute to a new set of replacement values such that each old value can be identified with one of the new values
- Simple functions: x^k^, log(x), e^x^, |x|
- Standardization and Normalization
Similarity and Dissimilarity
- Similarity
- Numerical measure of how alike two data objects are
- Is higher when objects are more alike
- Often falls in the range [0,1]
- Dissimilarity
- Numerical measure of how different are two data objects
- Lower when objects are more alike
- Minimum dissimilarity is often 0
- Upper limit varies
- Proximity refers to a similarity or dissimilarity
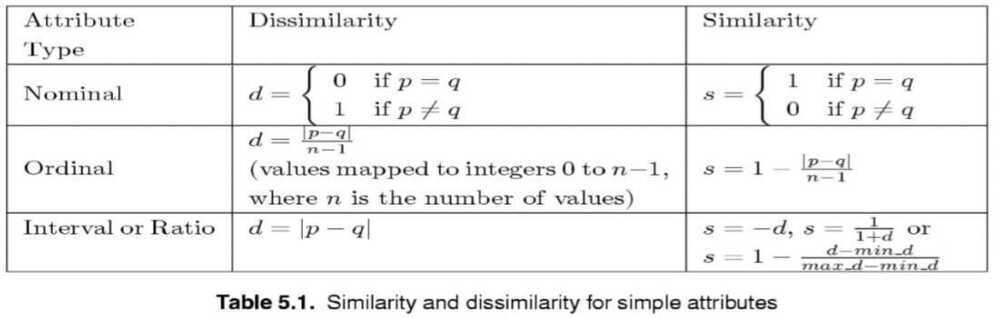
Similarity/Dissimilarity for Simple Attributes
p and q are the attribute values for two data objects
Types
- Euclidean Distance
- Mahalanobis Distance
- Manhattan Distance
- Jaccard Similarity
- Minkowski Distance
- Cosine Similarity
Euclidean Distance

- Where n is the number of dimensions (attributes) and p
kand qkare, respectively, the k^th^ attributes (components) or data objects p and q. - Standardization is necessary, if scales differ
Mahalanobis Distance
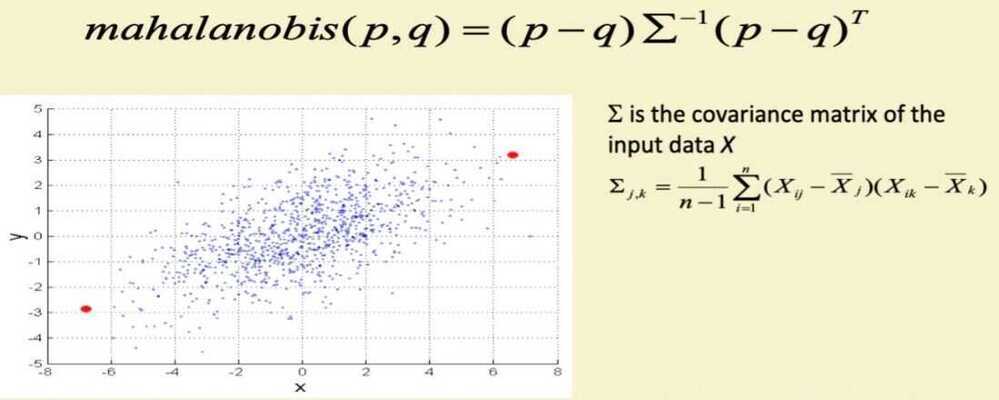
- For red points, the Euclidean distance is 14.7, Mahalanobis distance is 6
Cosine Similarity
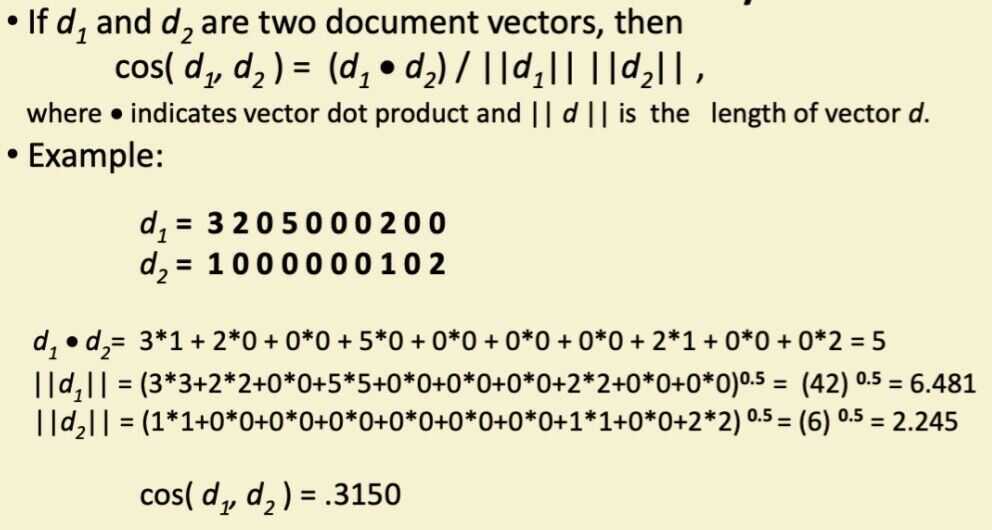
Cosine Similarity - GeeksforGeeks
Similarity Between Binary Vectors
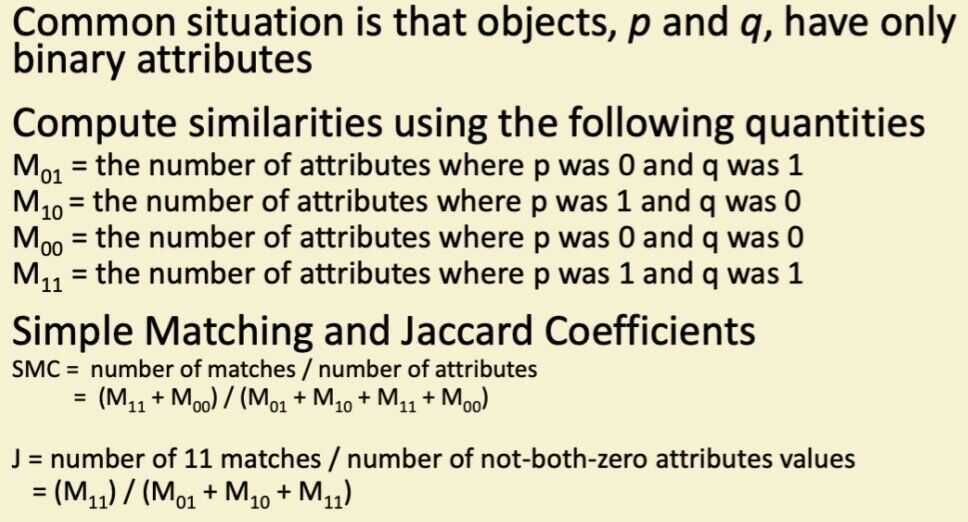
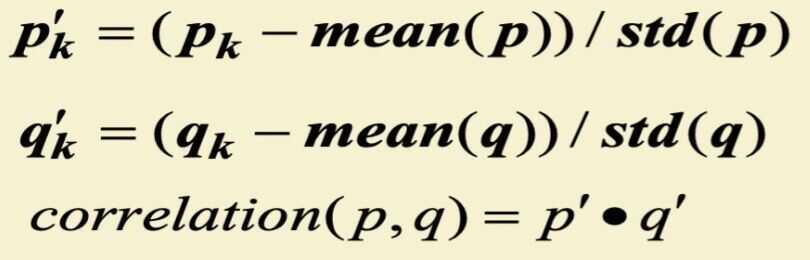
Correlation
- Correlation measures the linear relationship between objects
- To compute correlation, we standardize data objects, p and q, and then take their dot product
Visually Evaluating Correlation
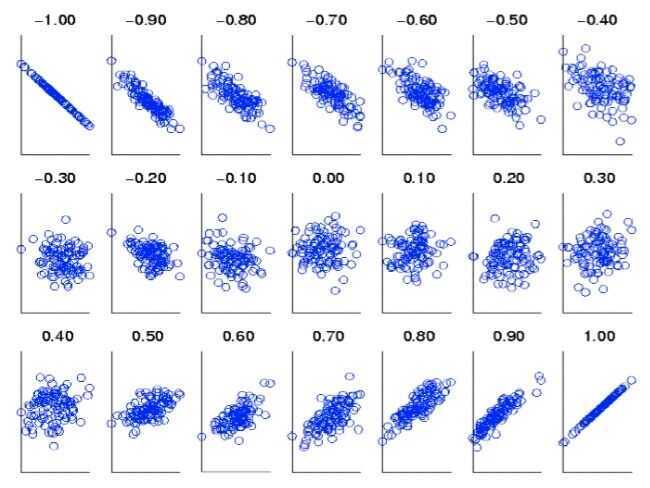
- Scatter plots showing the similarity from -1 to 1
Tidy Data
- https://vita.had.co.nz/papers/tidy-data.pdf
- https://cran.r-project.org/web/packages/tidyr/vignettes/tidy-data.html
- 10 Python One-Liners That Will Boost Your Data Preparation Workflow - MachineLearningMastery.com