Normal Distributions
In probability theory, the normal(or Gaussian or Gauss or Laplace--Gauss) distribution is a very common continuous probability distribution. Normal distributions are important in statistics and are often used in the natural and social sciences to represent real-valued random variables whose distributions are not known. A random variable with a Gaussian distribution is said to be normally distributed and is called a normal deviate.
The normal distribution is useful because of the central limit theorem. In its most general form, under some conditions (which include finite variance), it states that averages of samples of observations of random variables independently drawn from independent distributions converge in distribution to the normal, that is, become normally distributed when the number of observations is sufficiently large. Physical quantities that are expected to be the sum of many independent processes (such as measurement errors) often have distributions that are nearly normal. Moreover, many results and methods (such as propagation of uncertainty and least squares parameter fitting) can be derived analytically in explicit form when the relevant variables are normally distributed.
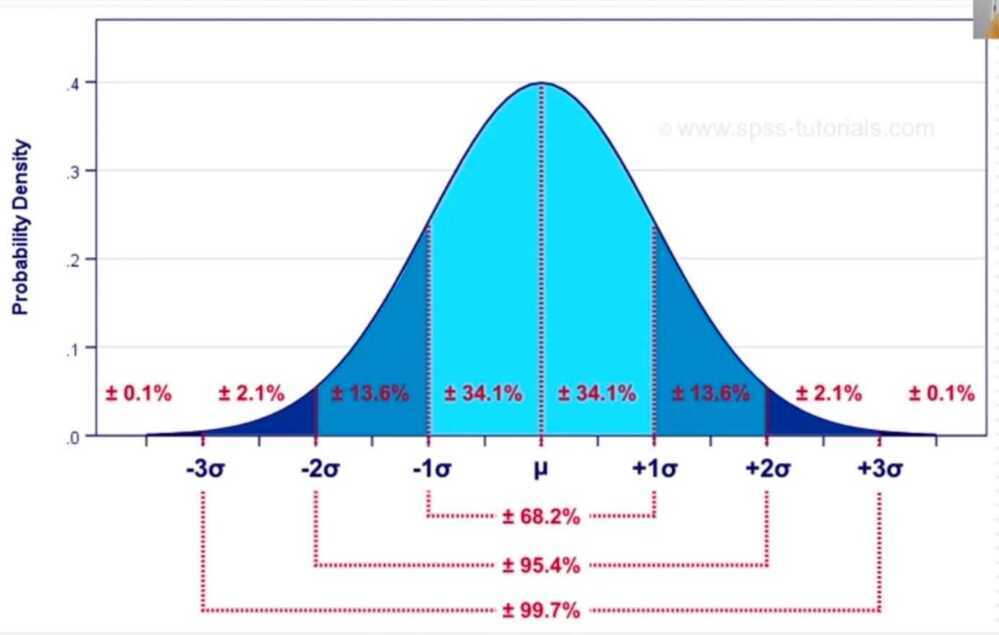
- 99% of the data should fall in 3 standard deviations from the mean
Properties of normal distributions
- Dispersion: The standard deviation in a normal distribution measures the spread around the mean, but with links to probabilities of a number occuring in the sample falling within or out of that spread
- Skewness: A normal distribution is symmetric and has no skewness
- Kurtosis: A variable that is normally distributed can take on values from minus infinity to plus infinity, but the likelihood of extreme values is contrained. The kurtosis for a normal distribution is three, which becomes the standard against which other distributions are measured
What is the Empirical Rule? | Statistics Ep. 12 - YouTube
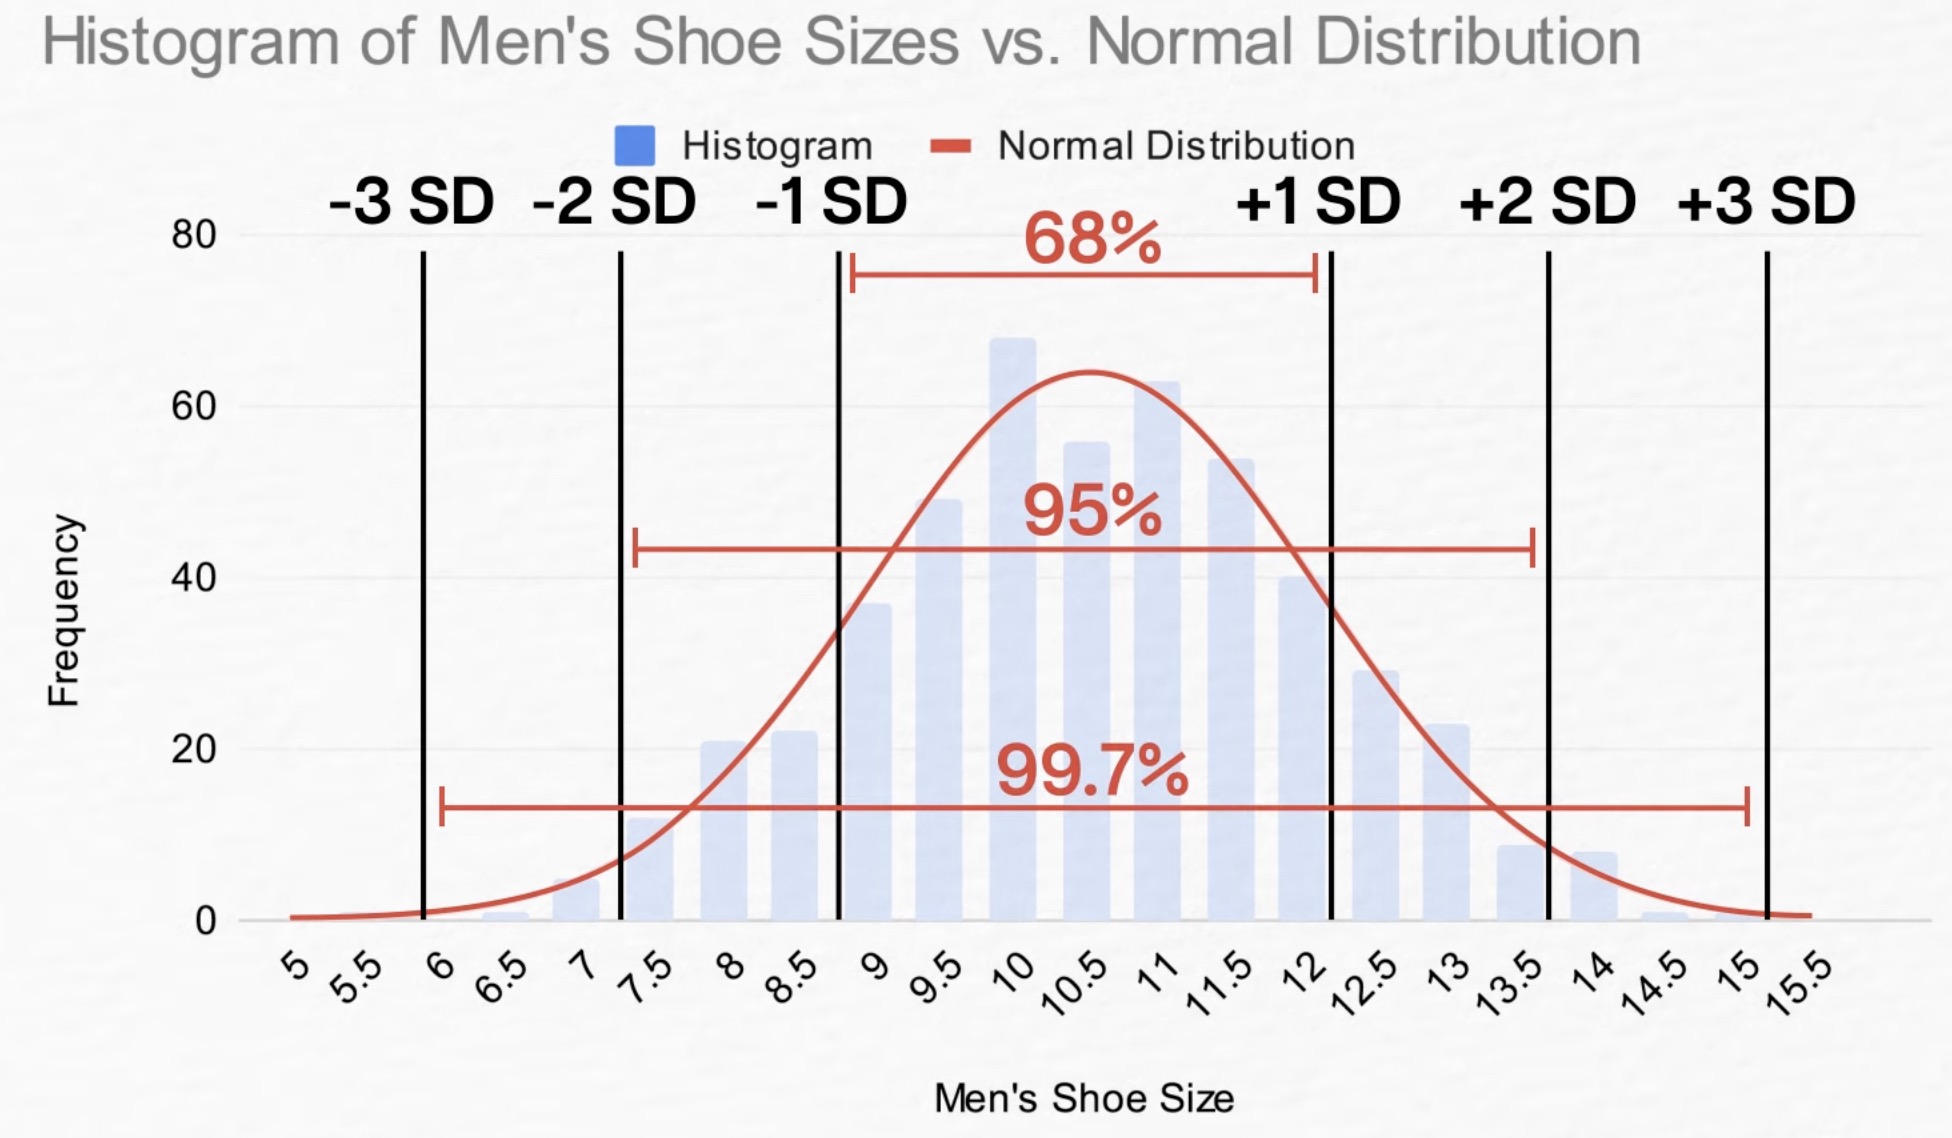
- 1 standard deviation - 68%
- 2 standard deviation - 95%
- 3 standard deviation - 99.7%
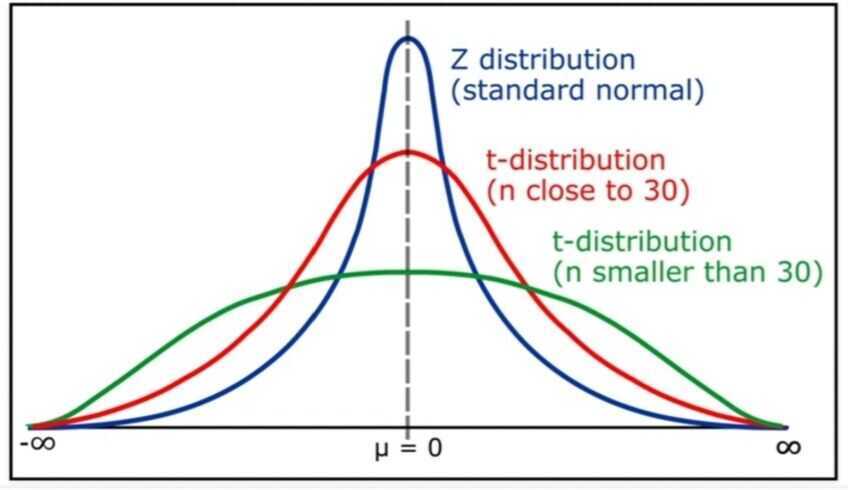
The t distribution
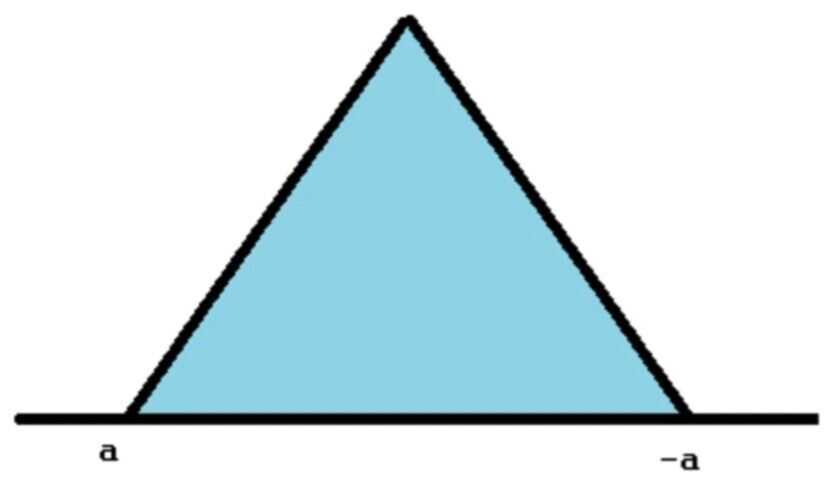
The Symmetric Triangular Distribution
A Uniform Distribution
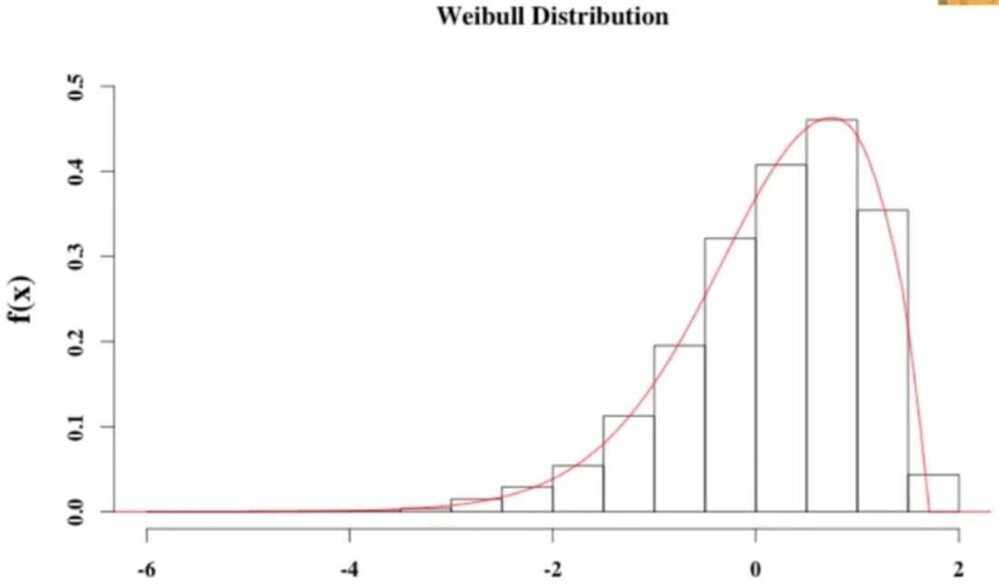
Negative Skew: Minimum Extreme Value
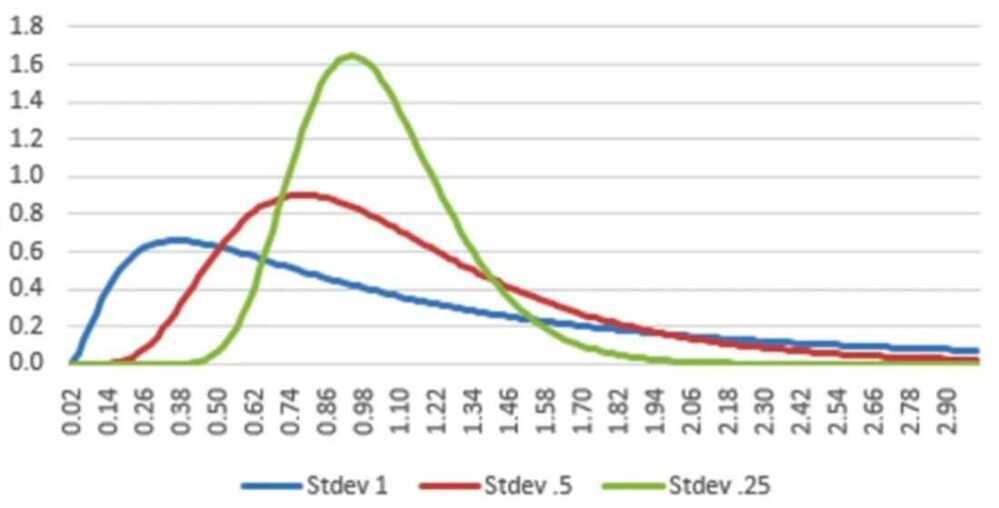
Positive Skew: Log Normal Distribution
Thin tails and Fat tails
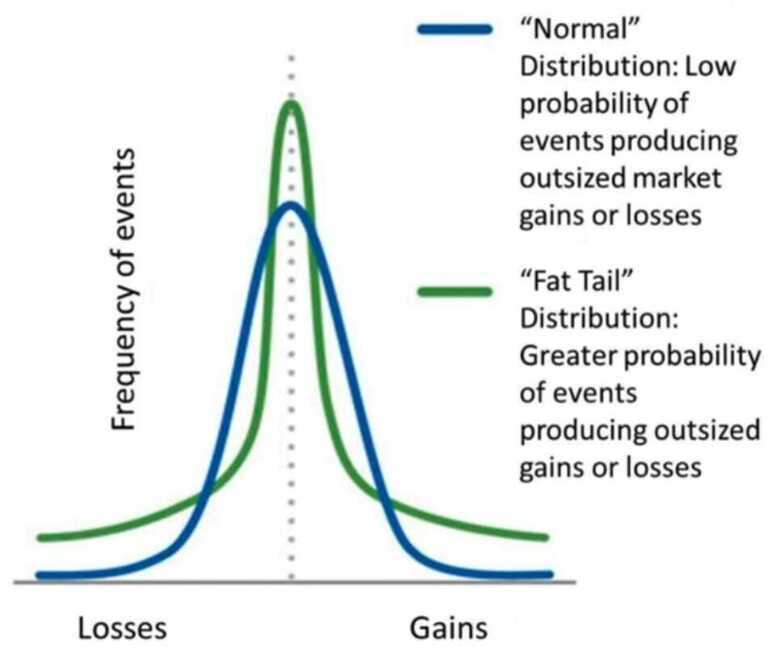
Measured with kurtosis
- Kurtosis is a measure of the combined weights of the tails, relative to the rest of the distribution
- Most often, kurtosis is measured against the normal distribution. Pearson's kurtosis is the excess kurtosis over three
- If the Pearson kurtosis is close to 0, then a normal distribution is often assumed. These are called mesokurtic distributions
- If the Pearson kurtosis is less than 0, then the distribution has thin tails and is called a platykurtic distribution. (Uniform distribution is a good example)
- If the Pearson kurtosis is greater than 0, then the distribution has fat tails and is called a leptokurtic distribution
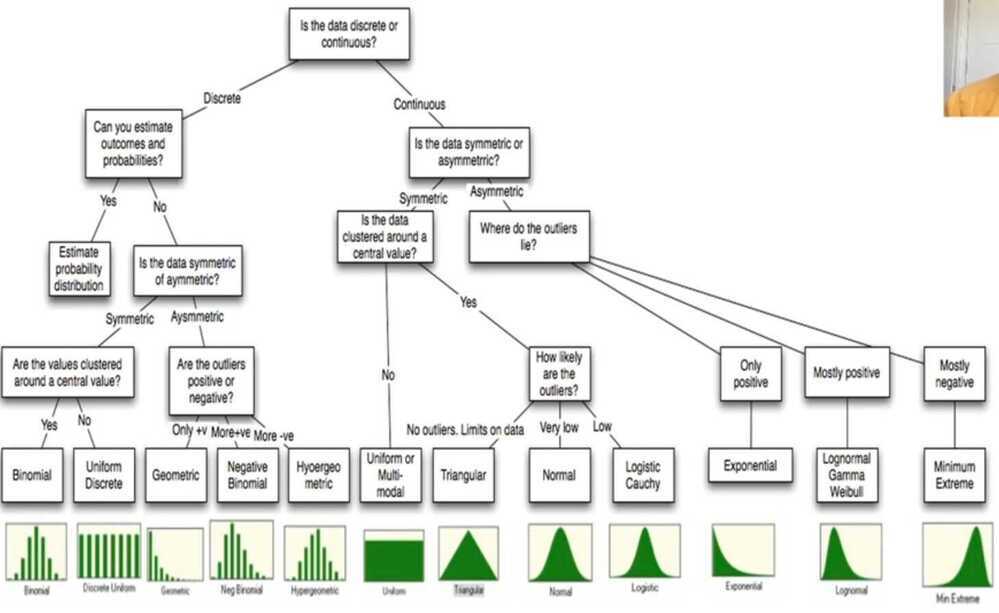
Properties of Normal Distribution are as follows
- Unimodal-onemode
- Symmetrical -left and right halves are mirror images
- Bell-shaped-maximum height (mode) at the mean
- Mean, Mode, and Median are all located in the center
- Asymptotic