Index Investing / ETF
What is a factor-based index?
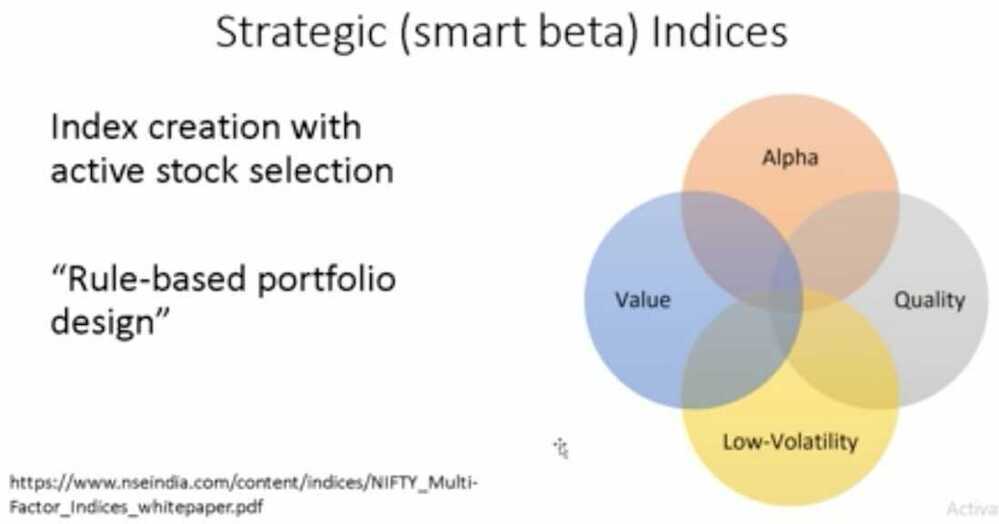
An index created by active stock selection using conditions such as low volatility, momentum, alpha, quality, value etc. and not market capitalization is called a factor index. Stocks in the index are weighted using these factors -- for eg. lower volatility stock has a higher weight. So this combines active stock-picking -- quantitative, rule-based -with passive investing (if an ETF or index fund follows this index).
What is a multi-factor index?
This is an index constructed with two or more factors or rules. For example, there are four multi-factor indices launched by the NSE:
- NIFTY Alpha Low-Volatility 30 = 50% alpha + 50% low volatility
- NIFTY Quality Low-Volatility 30 = 50% quality + 50% low volatility
- NIFTY Alpha Quality Low-Volatility 30 = 1/3 Alpha + 1/3 Quality + 1/3 Low Vol
- NIFTY Alpha Quality Value Low-Volatility 30 = 25% Alpha + 25% Quality + 25% Value + 25%Low Volatility
What is the benefit of a factor-index?
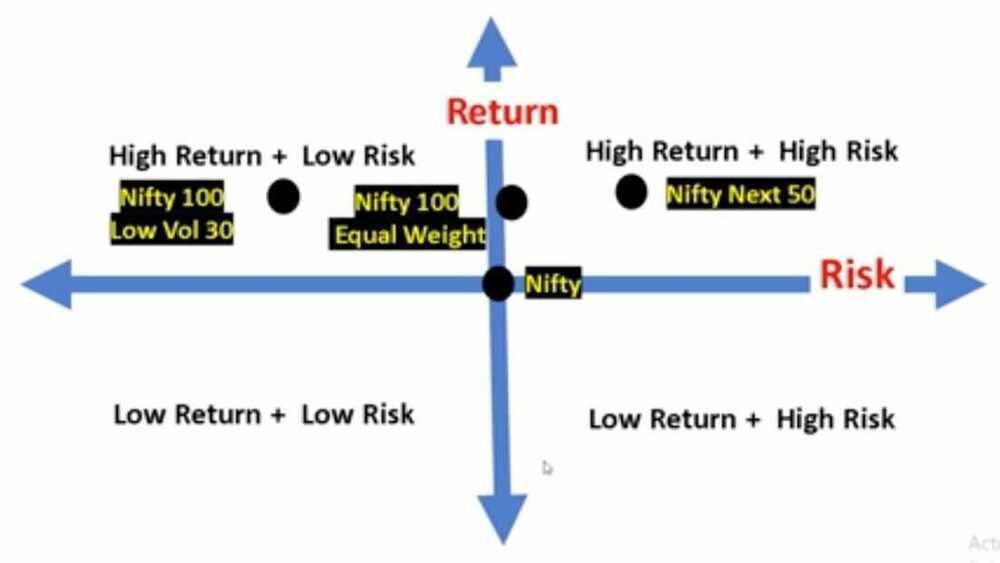
Unlike a market-cap based index, a factor-index often (not always) has a weighting cap of, for example, 5%. This lowers concentration risk. Depending on the rule used, a factor-based index can from time to time (not always) offer lower risk and/or higher returns than a market-cap based index.
What is the benefit of a multi-factor index?
This provides diversification in the rules. When an index house or fund house projects a single factor index or ETF, they would tell you "why a single-factor is better than a usual index". They would leave out the fact that a single factor may not work all the time or can be riskier. When they a project a multi-factor index or ETF they would go "Multi-factors counters the impact of the cyclicality of single-factor indices".
Strategic (smart beta) indices
NIFTY Alpha 30 Index
- Alpha = actual return - expected return (after comparing volatility with market)
- Higher the excess return + lower the volatility the better
NIFTY Quaity 30 Index
- Return on equity (ROE), Debt equity ratio (D/E) and average change in Profit After Tax (PAT) in previous 3 financial years
- 30 such stocks from Nifty 100 + Nifty Midcap 50 are chosen
NIFTY Value 30 Index
- Business durability: High ROCE (Return on Capital Employed), low PE, low PB and high Dividend yield (DY) in the last financial year with positive PAT
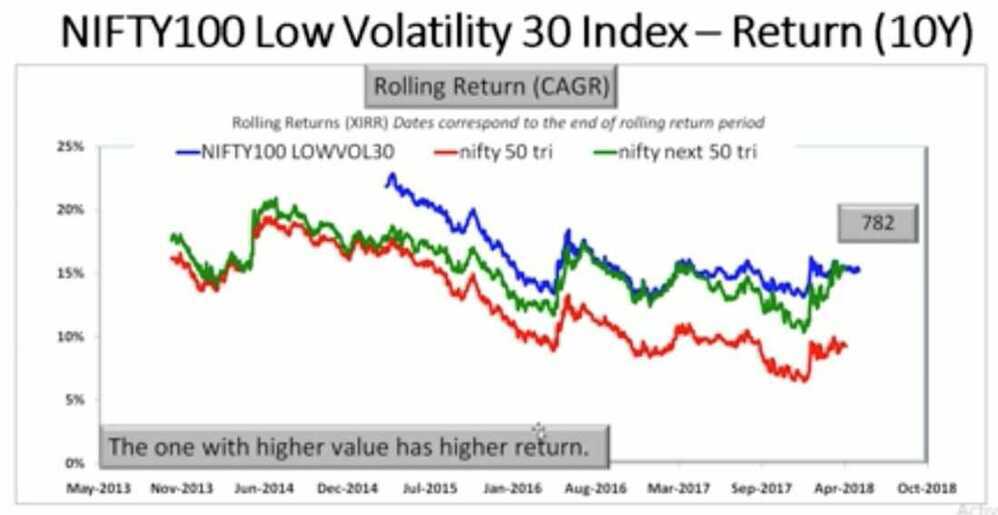
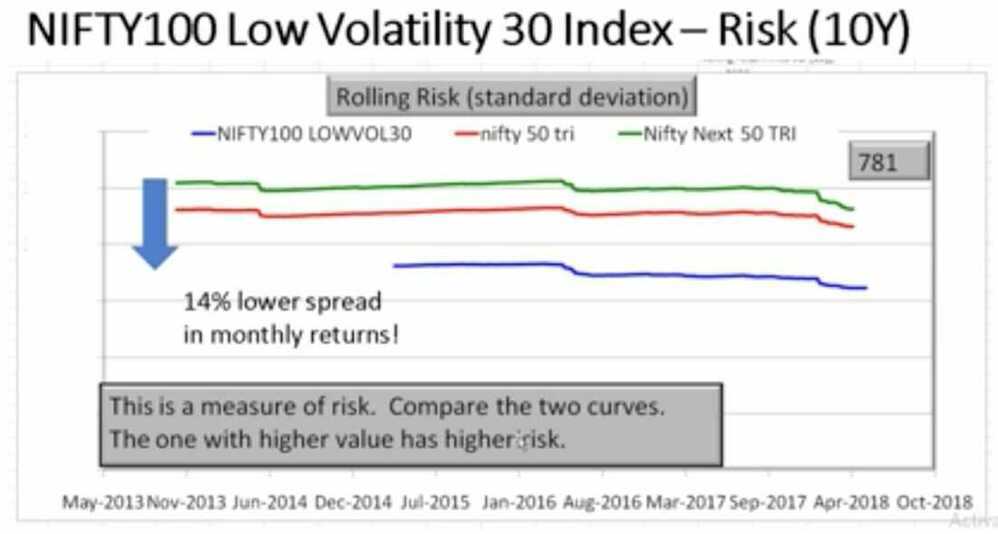
NIFTY100 Low Volatility 30 Index
- 30 least volatile stocks in the NIFTY 100
- It is a 30 stock index selected from NIFTY 100 and NIFTY Midcap 50 based on 50% Jensen's alpha and 50% low volatility. The index weight is capped at 5%.
- Just get the stocks of the index from Nifty 100 Low Vol 30
Investing options in Strategic Indices
-
Edelweiss ETF - Nifty Quality 30
-
ICICI Prudential Nifty Low Vol 30 ETF (Nifty Low Vol 30)
-
Reliance ETF NV20 (Nifty 50 Value 20 TRI)
-
ICICI Prudential NV20 ETF (Nifty 50 Value 20 TRI)
-
Kotak NV 20 ETF (Nifty 50 Value 20 TRI)
-
Price of NAV is very high
-
Unless you know how to trade, don't touch these
Index Funds
- Broad market index funds
- Market capatalization index funds
- Equal weight index funds
- Factor baesd or smart beta index funds
- Strategy index funds
- Sector based index funds
- International index funds
- Debt index funds
- Custom index funds
An index fund is a fund that holds all the stocks in the underlying index to mimic the overall performance of that index. At present, Nifty50 and Nifty Next50 are two best index fund options available for investors in India. These funds mimic the portfolio of the Nifty and Nifty Next50 Index, respectively.
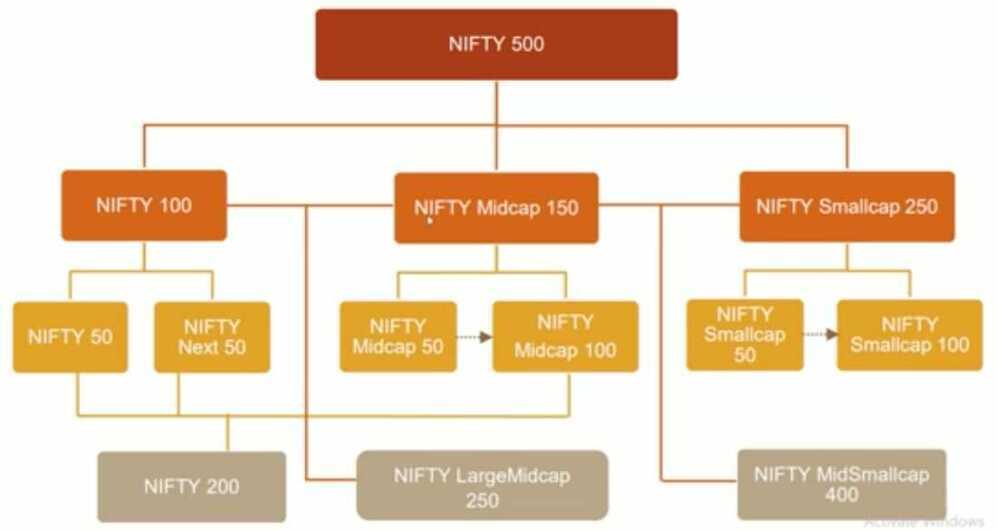
Bombay Stock Exchange (BSE) and the National Stock Exchange (NSE) are the two biggest stock exchanges in India. There are approximately 4500 listed companies on BSE and around 1600 listed companies on NSE. Most big companies are listed on both stock exchanges. Sensex is the stock market index of BSE, while Nifty is that of NSE.
The top 100 companies based on full market capitalisation listed on NSE are called Nifty100. Full market capitalisation is the current price of stock multiplied by the total number of stocks of the company. Or in simple words, it is the amount an investor needs to spend if he wants to purchase 100% ownership of the company.
Nifty50 index represents the top 50 companies from Nifty100 based on free-float market capitalisation. Free float market capitalisation is the market capitalisation calculated after excluding shares held by promoters and strategic investors.
Nifty Next50 Index represents 50 companies from Nifty100 after excluding the Nifty50 companies. Likewise, Sensex represents the top 30 companies listed on BSE by free-float market capitalisation.
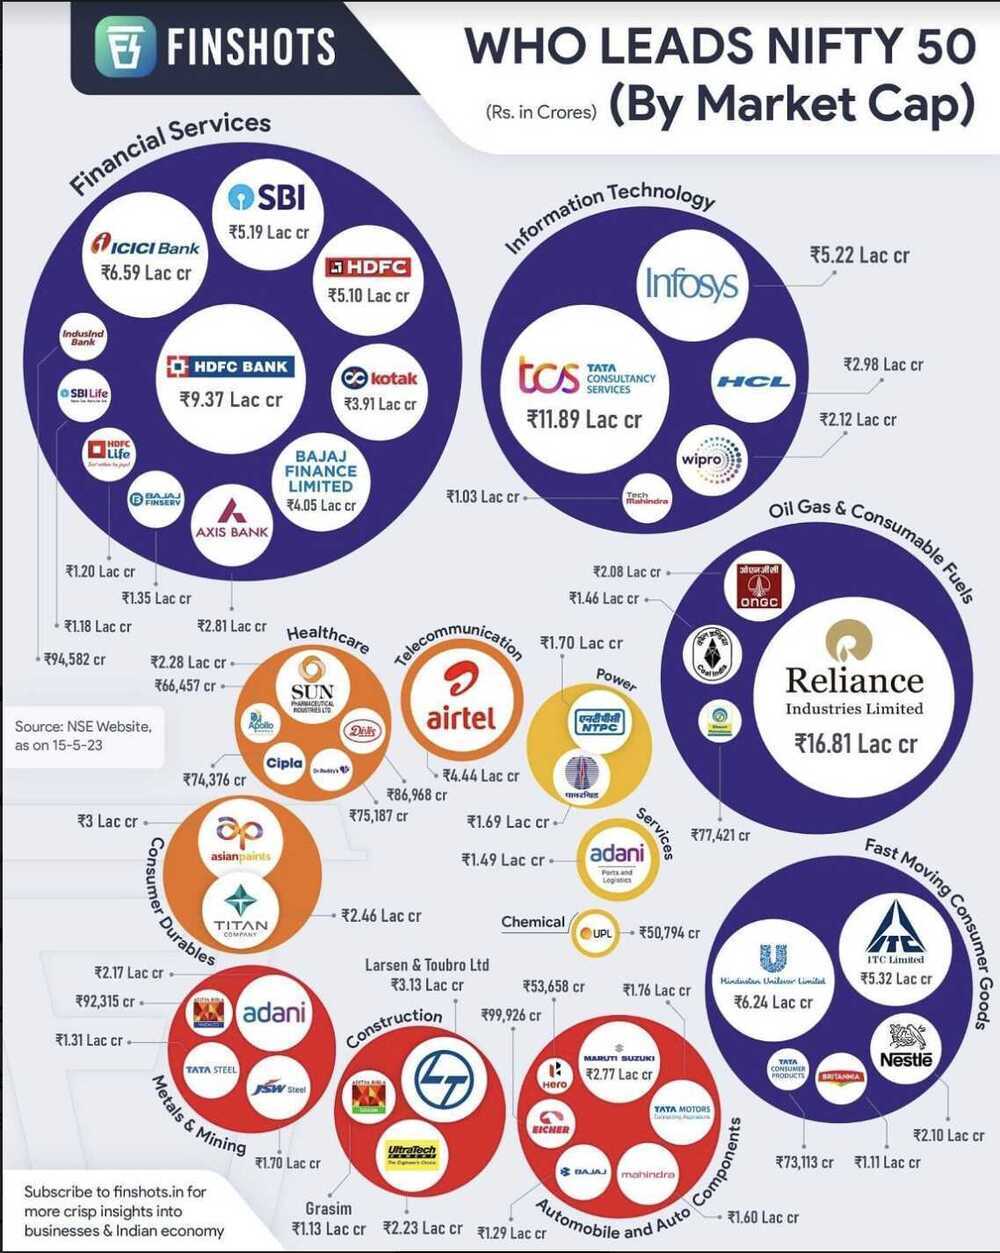
The weight of each stock in the index depends on its free-float market capitalisation. Higher the free-float market capitalisation of the company, higher its allocation in the index. At present, HDFC Bank is the biggest company in India by free-float market capitalisation; therefore, its weight is highest in both Nifty and Sensex. If the free-float market capitalisation of another Nifty business is 1/10th of HDFC Bank, its weight in Nifty would be 1/10th of HDFC Bank's weight.
Since the weight of each stock in the index depends on its free-float market capitalisation, which depends on the stock price, when the stock price of any company goes up, its weight in the index goes up. Likewise, weight of any business whose stock price goes down also automatically comes down. If any company is no longer in the top 50 companies by free-float market capitalisation, it is replaced by another successful company. In any calendar year, a maximum of five businesses can be replaced. These changes in the index are done semi-annually.
Nifty50 index value is calculated using the following formula:
Nifty50 Index Value = (Current total free-float market capitalisation of Nifty50 companies/total free-float market capitalisation of Nifty50 companies on Nov 03, 1995) * 1000
Though the Nifty50 index fund mimics the portfolio of the Nifty50 index, the returns from the index fund are higher than that of the Nifty50 index return. This happens because the dividend index fund scheme receives is reinvested in the portfolio. Nifty50 value doesn't reflect the effect of dividend reinvestment.
Index funds benefit from price discovery by the collective wisdom of the market. It is tough to outguess the market and generate a higher return.
Another big reason most actively managed funds underperform index funds is their higher expenses. Actively managed funds charge significantly higher expense compared to index funds (the expense ratio of HDFC Equity Fund-Direct Plan is 1.27% per annum as against 0.1% expense of HDFC Index Fund Nifty 50 Plan-Direct Plan).
https://freefincal.com/build-equity-mutual-fund-portfolio
ETFs vs Index Funds
- Why You Should Avoid ETFs | ETFs vs Index Funds - YouTube
- ETF vs Mutual Funds: How to Pick the Best for YOUR Goal? - YouTube
- Should You Choose NIFTY 50 ETF Over NIFTY 50 Index Fund?
- Which are better index funds or ETFs i am a newbie can anyone explain : r/mutualfunds
- Niftybees vs icici nifty 50 MF which one for long term? : r/mutualfunds
- Nifty50 ETF or Index fund - Which should one prefer? : r/IndiaInvestments
Should I switch to Index Funds?
- First learn to invest with a strategy
- Select an asset allocation for your need
- Learn how to manage risk systematically
- Then once confident, you can become an index investor
Benchmark Exchange Traded Schemes (BeEs)
Nippon India ETF Nifty BeES vs UTI Nifty Index Fund: Which is better?
- Nippon India ETF Nifty 50 BeES, NSE: NIFTYBEES
- Nippon India ETF Nifty Next 50 Junior BeES, NSE: JUNIORBEES
- SBI-ETF 10 Year GILT
- Motilal Oswal 5 Year G-Sec ETF
- 8-13 Year Govt Bonds Basket - Nippon
Exchange-traded fund (Index ETF)
An exchange-traded fund (ETF) is a collection of securities - such as stocks - that tracks an underlying index.
An ETF is called an exchange-traded fund since it's traded on an exchange just like stocks. The price of an ETF's shares will change throughout the trading day as the shares are bought and sold on the market. This is unlike mutual funds, which are not traded on an exchange, and trade only once per day after the markets close.
What is an ETF's Market price and NAV
- The ETF market price is the price at which an ETF can be bought or sold on the exchanges during trading hours. If more buyers than sellers arise, the price will rise in the market, and the price will decline if more sellers appear.
- The net asset value (NAV) of an ETF represents the value of each share of the fund's underlying assets and cash at the end of the trading day.
- An ETF is said to trade at a premium when its price exceeds its NAV. An ETF is said to trade at a discount when its price is below its NAV.
- Current - 100, selling - 101 (premium), selling - 99 (discount)
What is iNAV
- iNAV provides an intraday indicative Net Asset Value of an ETF based on the market values of its underlying constituents.
- iNAV is reported approximately every 10-15 seconds, hence it represents a near real-time view of the value of a fund..
- iNAV is a tool that helps to keep funds trading near their par value
- Reporting an iNAV can help a fund to avoid significant premium and discount trading
- How ETF Works? | iNAV concept Explained - YouTube
- How motilal oswal most shares nasdaq 100 etf returns are higher than nasdaq 100 index? : r/IndianStockMarket
- What is iNAV and how to view it on Kite?
- MON100
- MON100INAV
- Reserve Bank of India (RBI) limits how much AMCs can invest overseas. Currently, this limit is $7 billion for the entire industry and $1 billion per AMC.
Things to keep in mind when investing in ETF
- iNAV represents the "fair" price of an ETF, so paying substantially more (premium) or receiving substantially less (discount) than iNAV is generally ill-advised
- How high is the tracking error? - Tracking error is the difference between the returns of the fund and its benchmark index it is trying to mimic. A higher tracking error shows that the fund is not replicating the index truly.
- How liquid is the fund? - Liquidity can be an issue in case of ETFs as they can only be bought and sold on the exchanges. You would be able to sell only if there is enough demand and that may not always be the case.
- Expense Ratio?
Low Tracking Error Doesn't Guarantee Index Fund Return Matches Benchmark Return
ETFs
- NiftyBEES
- JuniorBEES
Links
- international-etfs
- gold-diamond-gold-etf
- Index Investing Options In India:
- What are the risks with index investing?
- Can I continue investing in Parag Parikh Flexi Cap Fund plus UTI Nifty 50 Index fund?
- Should you invest in the Nifty 500 Momentum 50 Index?
- The ‘S&P 500 Trap’, Explained. - YouTube
- Debunking the Index Fund Misconceptions: A Balanced Perspective
- An index with a portfolio turnover higher than active funds!
- Does long-term equity SIP investing work? (110 year analysis)
- Nifty 50 or Nifty 500, which index fund should I choose?
- Active Mid Cap Mutual Funds vs Nifty Midcap 150
- We are still waiting for an Aggressive Hybrid Index Fund