0 Accounting for Finance
Accounting 101 (taught by a non-accountant)
This is a course of short webcasts (about 12-20 minutes apiece), designed to introduce you to the basics of accounting, but more from the perspective of a user of financial statements than from someone who cares about accounting rules and standards. So, be forewarned! I have no qualms about saying terrible things about accounting standards and rule writers, rewriting accounting rules to fit my perspectives on valuation and corporate finance, and ignoring vast segments of accounting statements as useless in financial analysis.
| Session Webcast | Short Description | Supplementary Material |
|---|---|---|
| Preview | Introduction to sessions | Provides an introduction to (my) version of an accounting class. Perhaps, morea warning, than a sales pitch! |
| 1 | Financial Statements: An Overview | Provides an overview of the three financial statements and what they aim to do (and sometimes fail to do). |
| 2 | Income Statements: Measuring Profits | Go through an income statement, drawing distinctions between operating & financing expenses and measures of profitability. |
| 2A | Income Statements: Illustrations | Look at the income statements of a diverse set of companies, at different stages of life cycle and in different sectors. |
| 3 | Balance Sheets: Asset Base and Debt Due | Go through a balance sheet, looking at how assets get recorded on it, and how that measurement affects accounting measures of equity. |
| 3A | Balance Sheets: Illustrations | Look at the balance sheets of a diverse set of companies, at different stages of life cycle and in different sectors. |
| 4 | Cashflow Statements: Cash In and Out | Go through a cash flow statement, drawing out information that it provides on cash earnings and cash flows. |
| 4A | Cash Flow Statements: Illustrations | Look at the cashflow statements of a diverse set of companies, at different stages of life cycle and in different sectors. |
| 5 | Accounting Inconsistencies & Consequences | Look at the items (stock based compensation, R&D, leases) where there are accounting inconsistencies, and how they play out in the statements. |
| 5A | Accounting Inconsistencies: Illustrations | Look at the how to resolve inconsistencies in accounting in real-world examples. |
| 6 | Financial Ratios: Of comps and peer groups | Ratiosare scaling mechanisms, allowing for comparisons across companies and acrosstime. In this session, I look at a range of ratios that can help in analysis. |
| 6A | Financial Ratios: Illustrations | Look at using financial ratios to make judgments about profitability, leverage and liquidity with real-world examples. |
Courses
- Accounting - https://www.accountingcoach.com/accounting-basics/outline
- Aswath Damodaran - Foundations of Finance
References
Data Update 1 for 2022: It's Moneyball Time!
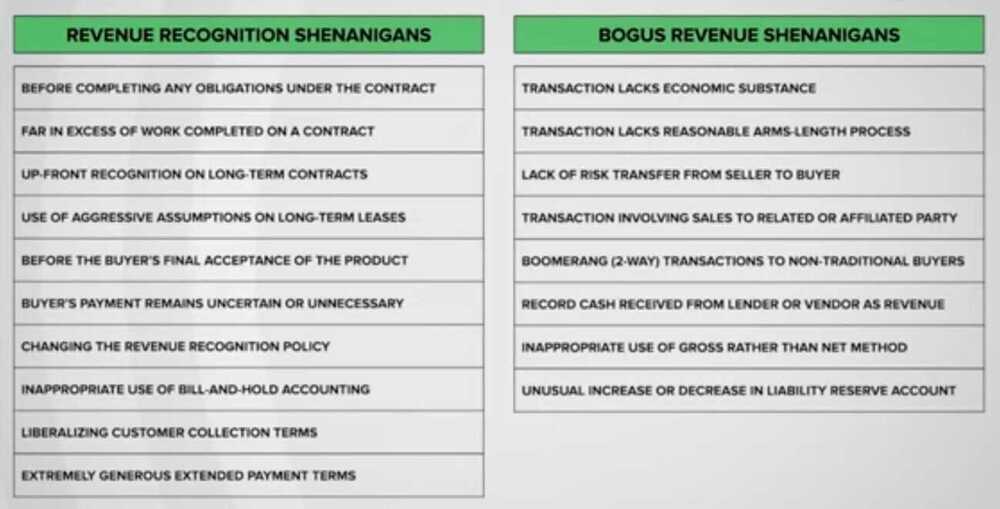
How Companies Cook Their Books (Part 1) | ET Money
- Bringing Time To A Halt
- In Excess Of Work Completed
- Assets Leased To Customers
- Before The Buyer's Final Acceptance
- Transactions Lacking Economic Substance
- When Loan Is Not A Liability, But A Sale
- Masquerading As A Large Company
How Companies Cook Their Books Part 2 | ET Money
- Failure to Record an Expense
- Playing with Reserves
- Pushing Expenses for later to boost income
- Using One-Time Events Creatively
- Boosting Income through Misleading Classifications
- Shifting Losses to Discontinued Operations
All Accounts
- Application of Funds (Assets)
- Current Assets
- Accounts Receivable
- Debtors
- Bank Accounts
- Cash In Hand
- Cash
- Loans and Advances (Assets)
- Securities and Deposits
- Earnest Money
- Stock Assets
- Stock In Hand
- Tax Assets
- Accounts Receivable
- Fixed Assets
- Capital Equipments
- Electronic Equipments
- Furnitures and Fixtures
- Office Equipments
- Plants and Machineries
- Buildings
- Accumulated Depreciations
- Investments
- Temporary Accounts
- Temporary Opening
- Current Assets
- Expenses
- Direct Expenses
- Stock Expenses
- Cost of Goods Sold
- Expenses Included In Valuation
- Stock Adjustment
- Stock Expenses
- Indirect Expenses
- Administrative Expenses
- Commission on Sales
- Depreciation
- Entertainment Expenses
- Freight and Forwarding Charges
- Legal Expenses
- Marketing Expenses
- Miscellaneous Expenses
- Office Maintenance Expenses
- Office Rent
- Postal Expenses
- Print and Stationary
- Rounded Off
- Salary
- Sales Expenses
- Telephone Expenses
- Travel Expenses
- Utility Expenses
- Write Off
- Exchange Gain/Loss
- Gain/Loss on Asset Disposal
- Direct Expenses
- Income
- Direct Income
- Sales
- Service
- Indirect Income
- Direct Income
- Source of Funds (Liabilities)
- Capital Account
- Reserves and Surplus
- Shareholders Funds
- Current Liabilities
- Accounts Payable
- Creditors
- Payroll Payable
- Stock Liabilities
- Stock Received But Not Billed
- Duties and Taxes
- TDS
- Loans (Liabilities)
- Secured Loans
- Unsecured Loans
- Bank Overdraft Account
- Accounts Payable
- Capital Account
Cheatsheet
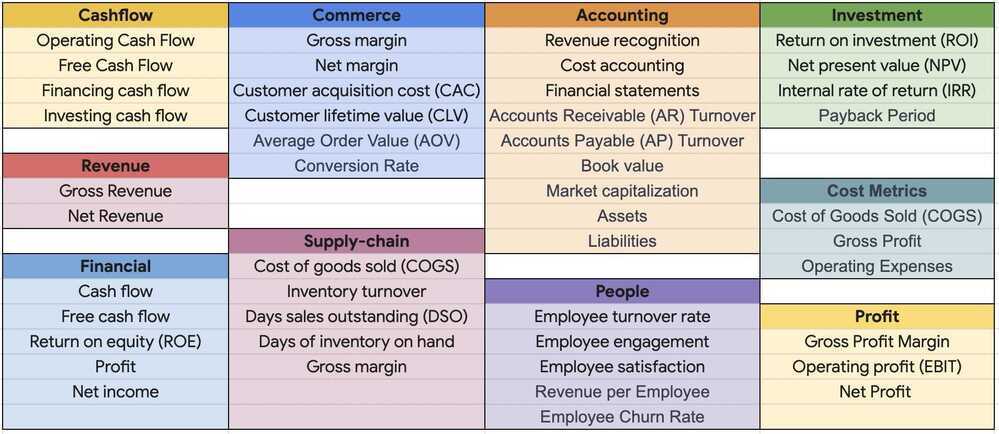
cashflow
- Operating Cash Flow: Cash generated or consumed by the company's regular operations.
- Formula: Net Income + Non-cash Expenses - Changes in Working Capital.
- Free Cash Flow: Cash available after all expenses and investments have been accounted for.
- Formula: Operating Cash Flow - Capital Expenditures.
revenue
- Gross Revenue: Total revenue generated from sales before deducting any costs or expenses.
- Formula: Total units sold x Average selling price per unit.
- Net Revenue: Revenue remaining after deducting discounts, returns, and allowances.
- Formula: Gross Revenue - Discounts - Returns - Allowances.
Cost
- Cost of Goods Sold (COGS): Direct costs associated with producing or delivering the product.
- Formula: Cost of raw materials + Labor cost + Manufacturing overhead.
- Gross Profit: Revenue minus the COGS.
- Formula: Net Revenue - COGS.
- Operating Expenses: Expenses incurred in running the business, including salaries, marketing costs, and administrative expenses.
- Formula: Employee salaries + Marketing expenses + Rent + Utilities.
profit
- Gross Profit Margin: The percentage of gross profit relative to revenue.
- Formula: (Gross Profit / Net Revenue) x 100.
- Operating Profit (EBIT): Profit earned from core operations before interest and taxes.
- Formula: Gross Profit - Operating Expenses.
- Net Profit: Profit remaining after deducting all expenses, including taxes and interest.
- Formula: Operating Profit - Taxes - Interest
financial
- Return on Investment (ROI): Measures the profitability of an investment relative to its cost.
- Formula: (Net Profit from Investment / Cost of Investment) x 100.
- Earnings Before Interest, Taxes, Depreciation, and Amortization (EBITDA): Measures a company's operating - rformance.
- Formula: Operating Profit + Depreciation + Amortisation.
accounting
- Accounts Receivable (AR) Turnover: Measures how quickly the company collects payments from customers.
- Formula: Net Revenue / Average Accounts Receivable.
- Accounts Payable (AP) Turnover: Measures how quickly the company pays its suppliers.
- Formula: COGS / Average Accounts Payable.
investment
- Return on Investment (ROI): Measures the profitability of an investment relative to its cost.
- Formula: (Net Profit from Investment / Cost of Investment) x 100.
- Payback Period: Length of time required to recover the initial investment.
- Formula: Cost of Investment / Annual Cash Flows.
Revenue vs Margin
- Buying Price - 50000
- Selling Price - 75000
1. Calculation 1
(75000-5000)/50000 = 50%
- Here, the denominator is 50000.
- This formula calculates the markup on cost (markup percentage).
- It answers: "How much profit is being made as a percentage of the cost?"
- Name: Markup Percentage
2. Calculation 2
(75000-5000)/75000 = 33%
- Here, the denominator is 75000.
- This formula calculates the profit margin or gross margin percentage.
- It answers: "What portion of the revenue is profit?"
- Name: Profit Margin Percentage
Key Difference
- Markup Percentage is based on cost (how much you add on top of cost).
- Profit Margin Percentage is based on revenue (how much of the revenue is profit).
- Markup is always higher than profit margin for the same numbers.
Why businesses uses profit margin rather than markup for comparing companies?
Businesses and investors use profit margin rather than markup when comparing companies because profit margin is a standardized measure of profitability, whereas markup varies based on cost structures. Here’s why:
1. Profit Margin is Relative to Revenue (Apples-to-Apples Comparison)
- Profit Margin = Profit / Revenue → It tells how much of the revenue is actual profit.
- Since revenue is a standard metric across industries, companies of different sizes and business models can be compared fairly.
- Example: A company with a 20% profit margin means it retains ₹20 profit for every ₹100 in revenue, regardless of cost structures.
2. Markup is Based on Cost (Not Always Comparable)
- Markup = Profit / Cost → It tells how much extra is added over cost.
- Cost structures vary significantly across industries, making markup a poor comparison tool.
- Example: A software company may have low costs but high markup, whereas a manufacturing company may have higher costs and a lower markup.
3. Investors & Analysts Use Profit Margins for Decision-Making
- Gross Profit Margin, Operating Margin, and Net Profit Margin are key financial indicators in earnings reports.
- Investors compare profit margins to assess efficiency, profitability, and risk.
- Example: If Company A has a 40% gross margin and Company B has 25%, Company A is likely more efficient at turning revenue into profit.
4. Profit Margins Reflect Business Health & Strategy
- Companies with similar markups can have different profit margins due to operational costs, overhead, and pricing strategies.
- Profit margin accounts for all costs and revenue, giving a clearer picture of financial health.
Summary
- Profit margin is used for comparing businesses across industries because it’s based on revenue and reflects overall profitability.
- Markup is useful for internal pricing strategies but not for comparing companies with different cost structures.