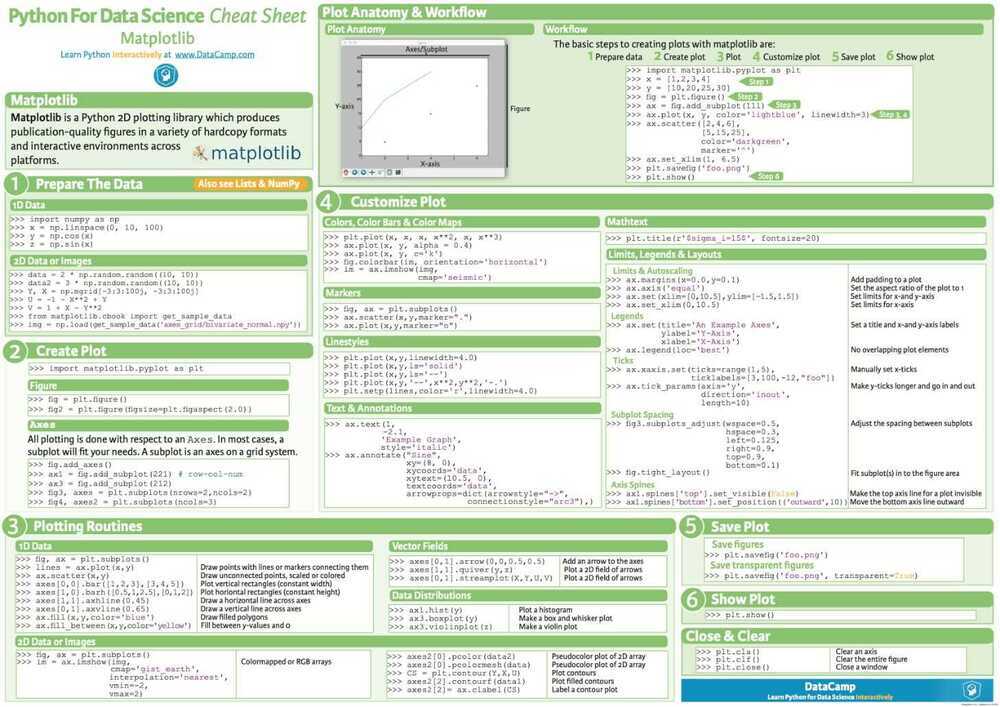
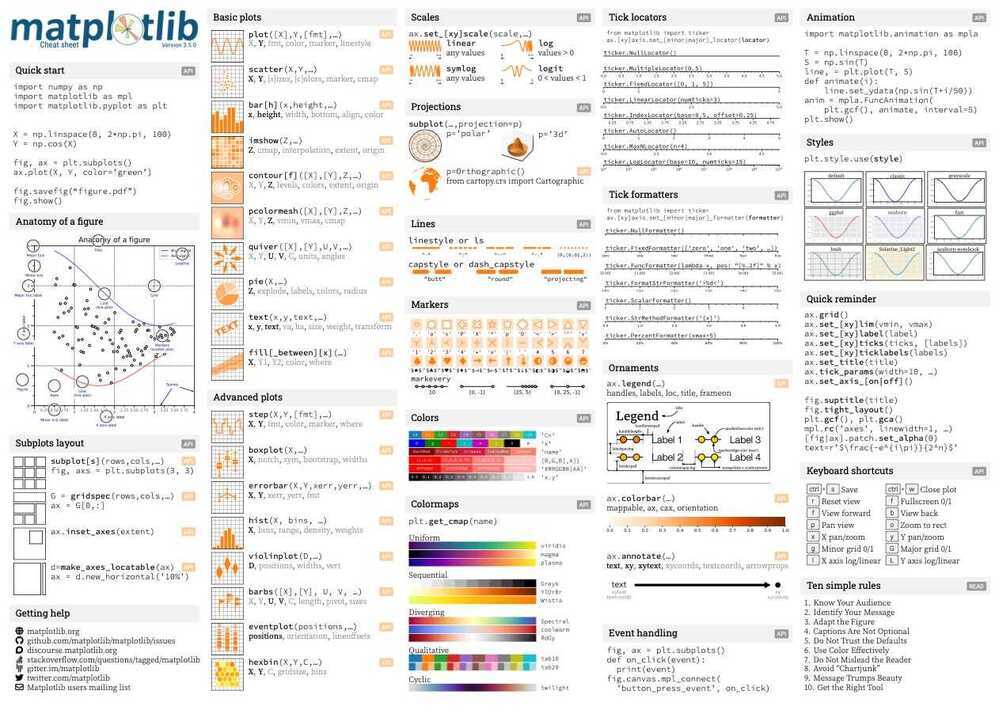
Matplotlib
Matplotlib
2-dimensional graphs and plots
https://www.dataquest.io/blog/matplotlib-tutorial
https://www.machinelearningplus.com/plots/top-50-matplotlib-visualizations-the-master-plots-python
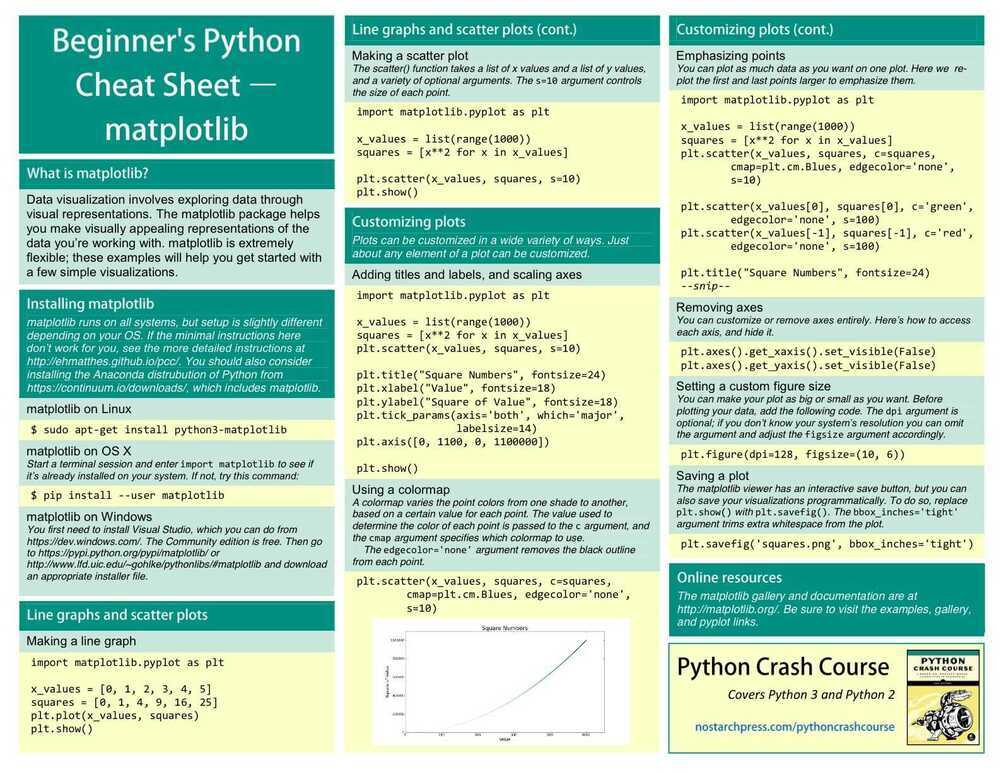
import matplotlib.pyplot as plt
plt.bar(range(len(counts)), counts)
plt.show()
plt.hist(tweets ["user_age"])
plt.show()
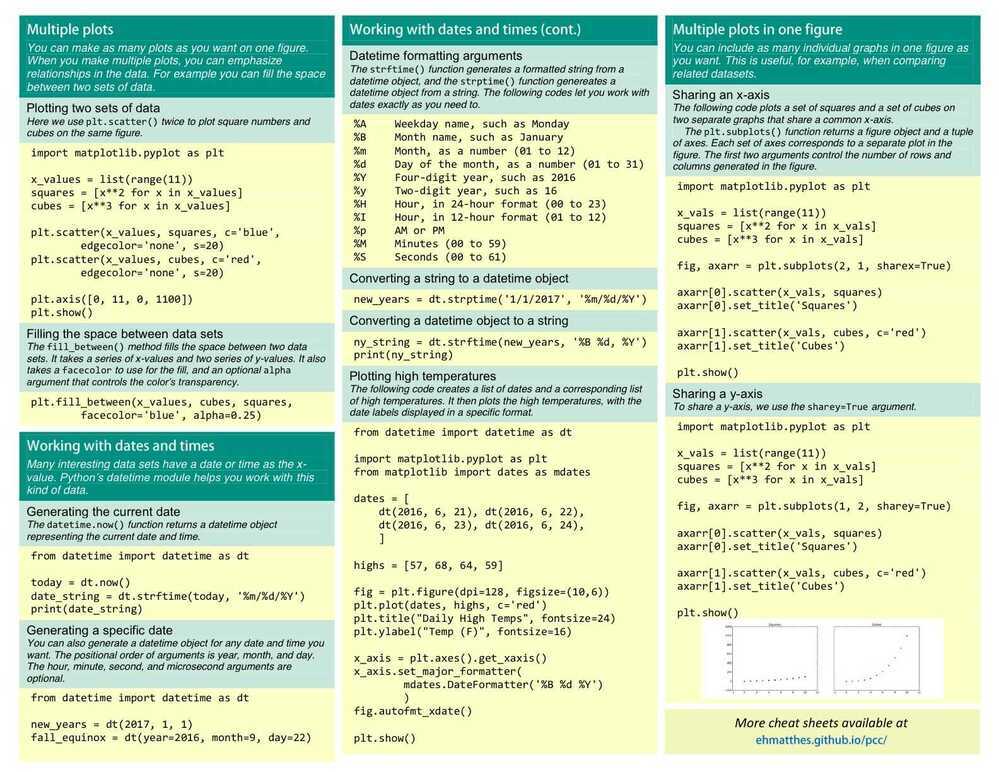
plt.hist(tweets ["user_age"])
plt.title("Tweets mentioning candidates")
plt.xlabel("Twitter account age in years")
plt.ylabel("# of tweets")
plt.show()
plt.hist([
cl_tweets,
sa_tweets,
tr_tweets
],
stacked = True,
label=["clinton", "sanders", "trump"]
)
plt.legend()
plt.title("Tweets mentioning each candidate")
plt.xlabel("Twitter account age in years")
plt.ylabel("# of tweets")
plt.show()
Others
seaborn
https://stackabuse.com/seaborn-library-for-data-visualization-in-python-part-1