Charts
Graphic Types
-
Pareto chart
-
Area chart
-
Control chart
-
Run chart
-
Sankey diagrams
-
Stem-and-leaf display
-
Cartogram
-
Small multiple
-
Sparkline table
-
Network
-
Stream graph
-
Tree map
-
Heat map
-
Pheno plot
-
Cladogram - https://en.wikipedia.org/wiki/Cladogram
-
Flame Graphs
- Icicle graph
- Flame Charts
- Miha Rekar - What Are Flame Graphs and How to Read Them, RubyConfBY 2017
- USENIX ATC '17: Visualizing Performance with Flame Graphs
- Django
-
Sparklines
Basic Charts
- Scatter Plots (2D / 3D)
- Line Charts - Tableau Line & Area Chart Catalogue | Tableau Public
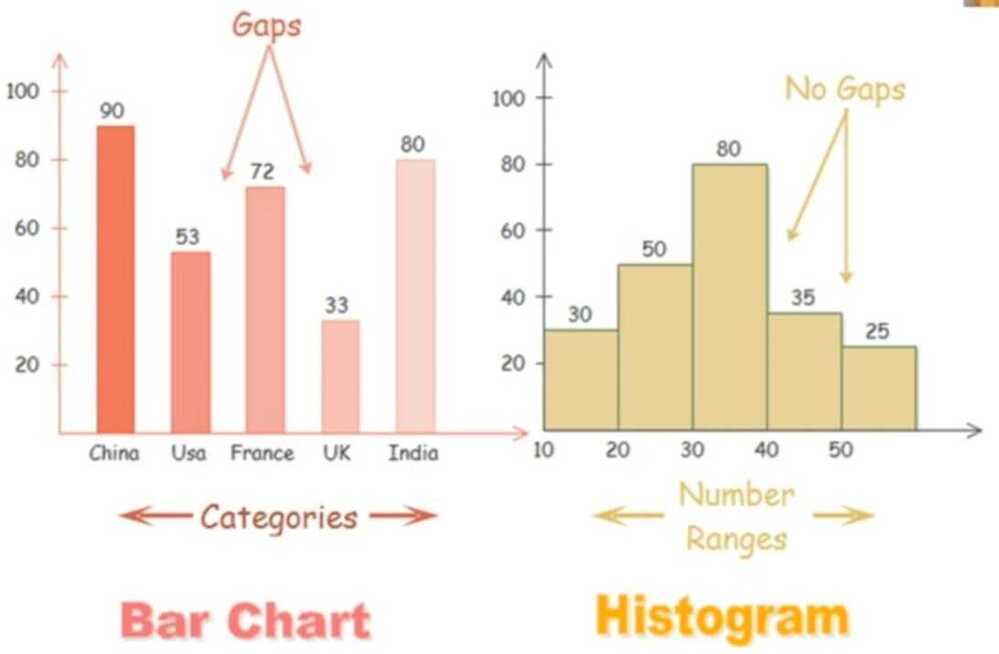
- Bar Charts
- Horizontal Bar Charts
- Pie Charts
- Bubble Charts
- Dot Plots
- Filled Area Plots
- Gantt Charts
- Tables
- Gauge Charts
- Sanky Diagram
- Linear-Gauge Chart
Statistical and Seaborn-style Charts
- Error Bars
- Continuous Error Bars
- Box Plots
- Histograms - https://www.datacamp.com/community/tutorials/histograms-matplotlib
- Distplots
- 2D Histograms
- 2d Density Plots
- Bullet Charts
- Scatterplot matrix
- Splom
- Facet and Trellis Plots
- Tree-plots
- Treemaps
- Violin Plots
- 2D Histogram Contour
Scientific Charts
- Log Plots
- Contour Plots
- Heatmaps
- WebGL Heatmaps
- Annotated Heatmaps
- Dendrograms
- Wind Rose Charts
- Ternary Plots
- Ternary Contour Plots
- Ternary Overlay
- Parallel Coordinates Plot
- Quiver Plots
- Streamline Plots
- Network Graphs Comparison
- Network Graphs
- Alpha Shapes
- Python Chrod Diagram
- Filled Chord Diagram
- Carpet Plots
- Carpet Contour Plot
- Carpet Scatter Plot
- Polar Charts
- Radar Charts / Radar Graphs
Financial Charts
- Time Series
- OHLC Charts
- Candlestick Charts
- Funnel Charts
Maps
- USA County Choropleth Maps
- Choropleth Maps
- Mapbox Choropleth Maps
- Scatter Plots on Maps
- Bubble Maps
- Lines of Maps
- Scatter Plots on Mapbox
- Tesla Supercharging Stations
3D Charts
- 3D Scatter Plots
- 3D Bubble Charts
- 3D Line Plots
- Ribbon Plots
- 3D Filled Line Plots
- 3D Surface Plots
- 3D Mesh Plots
- 3D Wireframe Plots
- Parametric Plots
- Trisurf Plots
- Surface Triangulation
- Iso Surface
- 3D Network Graphs
- 3d Clustering
- Projection of 3D Surface
Multiple Axes, Subplots, and Insets
- Multiple Axes
- Subplots
- Inset Plots
- 3D Subplots
- Map Subplots
- Mixed Subplots
- Figure Factory Subplots
- Table and Chart Subplots
Transforms
- Filter
- Group By
- Aggregations
- Multiple Transforms
Add Custom Controls
- Dash - Controls with Python Callbacks
- Custom Buttons
- Sliders
- Dropdown Menus
- Range Slider and Selector
Animations
- Intro to Animations
- Adding Sliders to Animations
- Filled-Area Animation
- Visualizing MRI Volume Slices
- Heatmap Animation