Data Analysis
https://www.freecodecamp.org/learn/data-analysis-with-python
"All models are wrong, some are useful" - George Box
"Better to be roughly right than precisely wrong" - John Keynes
Data Analysis
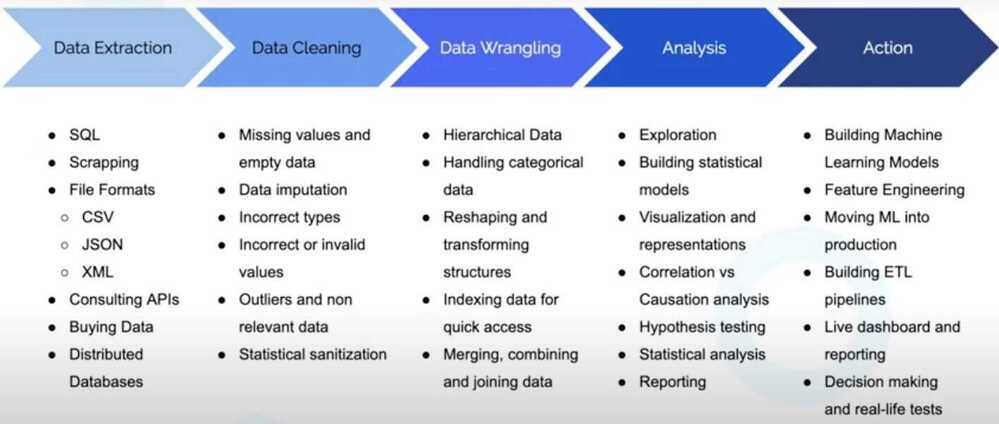
A process of inspecting, cleansing, transforming and modeling data with the goal of discovering useful information, informing conclusion and supporting decision-making.
Exploratory Data Analysis (EDA)
In statistics, exploratory data analysis is an approach to analyzingdata sets to summarize their main characteristics, often with visual methods. A statistical model can be used or not, but primarily EDA is for seeing what the data can tell us beyond the formal modeling or hypothesis testing task. EDA is different from initial data analysis (IDA), which focuses more narrowly on checking assumptions required for model fitting and hypothesis testing, and handling missing values and making transformations of variables as needed. EDA encompasses IDA.
- We can always use EDA to get insights on the data we are working on.
- Practice of using visual & quantitative methods to understand a dataset without making assumptions about its contents.
- Anscombe's Quartet
Anscombe's quartet comprises four data sets that have nearly identical simple descriptive statistics, yet have very different distributions and appear very different when graphed. Each dataset consists of eleven (x, y) points. They were constructed in 1973 by the statisticianFrancis Anscombe to demonstrate both the importance of graphing data before analyzing it and the effect of outliers and other influential observations on statistical properties. He described the article as being intended to counter the impression among statisticians that "numerical calculations are exact, but graphs are rough."
https://en.wikipedia.org/wiki/Anscombe%27s_quartet
-
ggplot2, The Gramer of Graphics
-
We have to remove outliers, so it does not skew out classifiers.
-
Maximum penetration into the data
-
Identification of basic structures
-
Selection of the most important variables
-
Detection of deviations and anomalies
-
Testing of basic hypotheses
Unlock the Power of Data Analytics with Free Google Services
A Course in Exploratory Data Analysis