Service Monitoring and Log Management Tools
Heartbeat
Heartbeat is a lightweight daemon that you install on a remote server to periodically check the status of your services and determine whether they are available. Unlike Metricbeat, which only tells you if your servers are up or down, Heartbeat tells you whether your services are reachable.
https://www.elastic.co/guide/en/beats/heartbeat/current/heartbeat-overview.html
FluentBit
Fluent Bit is an open source and multi-platformLog Processor and Forwarderwhich allows you to collect data/logs from different sources, unify and send them to multiple destinations. It's fully compatible with Docker and Kubernetes environments.
Fluent Bit is written inC, have a pluggable architecture supporting around 30 extensions. It's fast and lightweight and provide the required security for network operations through TLS.
https://github.com/fluent/fluent-bit
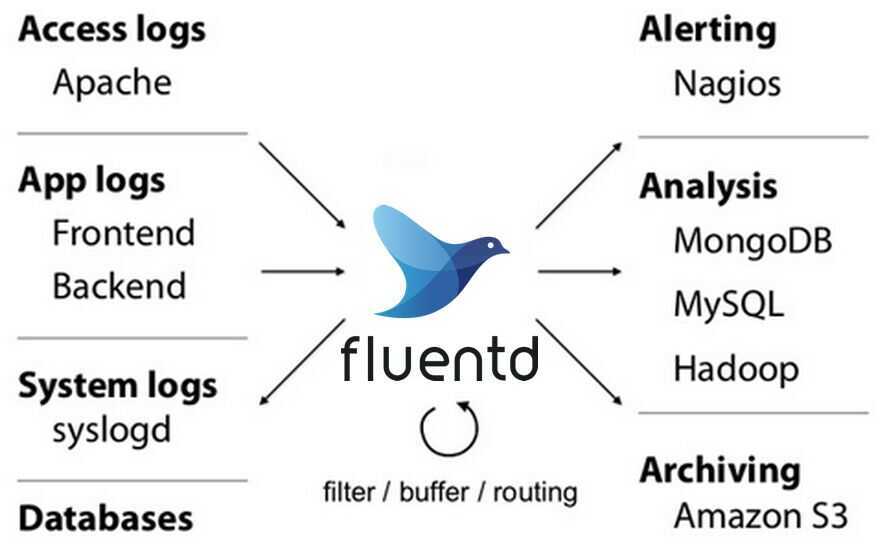
Fluentd
Fluentd is an open source data collector for unified logging layer.
Unified Logging with JSON
Fluentd tries to structure data as JSON as much as possible: this allows Fluentd to unify all facets of processing log data: collecting, filtering, buffering, and outputting logs across multiple sources and destinations(Unified Logging Layer). The downstream data processing is much easier with JSON, since it has enough structure to be accessible while retaining flexible schemas.
Pluggable Architecture
Fluentd has a flexible plugin system that allows the community to extend its functionality. Our 500+ community-contributed plugins connect dozens of data sources and data outputs. By leveraging the plugins, you can start making better use of your logs right away.
Minimum Resources Required
Fluentd is written in a combination of C language and Ruby, and requires very little system resource. The vanilla instance runs on 30-40MB of memory and can process 13,000 events/second/core. If you have tighter memory requirements (-450kb), check out Fluent Bit, the lightweight forwarder for Fluentd.
Built-in Reliability
Fluentd supports memory- and file-based buffering to prevent inter-node data loss. Fluentd also supports robust failover and can be set up for high availability. 2,000+ data-driven companies rely on Fluentd to differentiate their products and services through a better use and understanding of their log data.
An event consists of tag, time andrecord. Tag is a string separated with '.' (e.g. myapp.access). It is used to categorize events. Time is a UNIX time recorded at occurrence of an event. Record is a JSON object.
https://github.com/fluent/fluentd
https://www.youtube.com/watch?v=Gp0-7oVOtPw&ab_channel=ThatDevOpsGuy
Splunk
Splunk is a software technology which is used for monitoring, searching, analyzing and visualizing the machine generated data in real time. It can monitor and read different type of log files and stores data as events in indexers. This tool allows you to visualize data in various forms of dashboards.
https://www.guru99.com/splunk-tutorial.html
Eland
Eland is a Python Elasticsearch client for exploring and analyzing data residing in Elasticsearch with a familiar Pandas-compatible API.
Where possible the package uses existing Python APIs and data structures to make it easy to switch between numpy, pandas, scikit-learn to their Elasticsearch powered equivalents. In general, the data resides in Elasticsearch and not in memory, which allows Eland to access large datasets stored in Elasticsearch.
https://towardsdatascience.com/elasticsearch-for-data-science-just-got-way-easier-95912d724636
https://github.com/elastic/eland
Application Performance Monitoring (APM)
Application Performance Monitoring (APM) collects in-depth performance metrics and errors from inside your application. It allows you to monitor the performance of thousands of applications in real time.
Others
- Dynatrace
- Newrelic
- Elasticsearch APM / Elastic APM
- Pingdom
- Pagerduty
- CubeAPM - CubeAPM
- CubeAPM is an Application Performance Monitoring (APM) platform. It collects telemetry data from applications and infrastructure, and provides a UI for users to visualize and query the data. It also provides the ability to set up alerts based on the telemetry data, and sending notifications to users over various channels like Email, Slack, PagerDuty, Google Chat, etc.
- GitHub - coroot/coroot: Coroot is an open-source APM & Observability tool, a DataDog and NewRelic alternative 📊, 🖥️, 👉. Powered by eBPF for rapid insights into system performance. Monitor, analyze, and optimize your infrastructure effortlessly for peak reliability at any scale. ⭐ 7.7k
Flask
Please note that errors and transactions will only be sent to the APM Server if your app isnotin debug mode.
https://www.elastic.co/guide/en/apm/agent/python/current/flask-support.html
https://toptechtips.github.io/2019-07-08-add_python_code_to_apm