Crosstab
A crosstab is a table showing the relationship between two or more variables. Where the table only shows the relationship between two categorical variables, a crosstab is also known as a contingency table.
For a precise reference, a cross-tabulation is a two- (or more) dimensional table that records the number (frequency) of respondents that have the specific characteristics described in the cells of the table. Cross-tabulation tables provide a wealth of information about the relationship between the variables.
Crosstabs with more than two variables
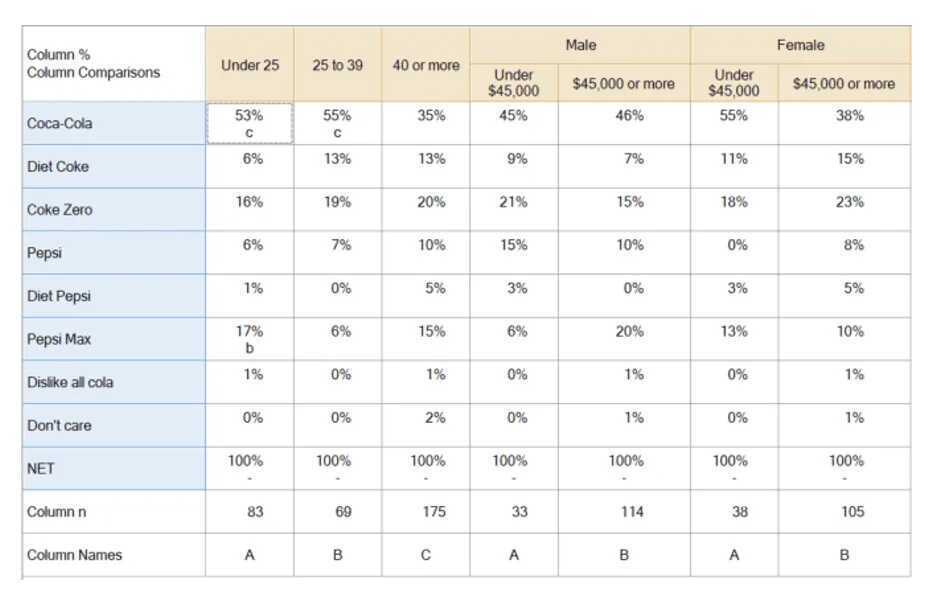
It is common for crosstabs to contain more than two variables. For example, the table below shows four variables. The rows represent one categorical variable, which records brand preference, and the columns represent age and income-within-gender.

Key decisions when creating a crosstab
In addition to selecting which variables to include in a crosstab, it is also necessary to work out which statistics to show. In this example, column % and the sample size for each column is shown.
A second key decision is how to show statistical significance. The example above uses lettering, which indicates whether a column is significant to another specific column. Alternatively, tests can be used which show whether a cell is different from its complement.
When should you use cross-tabulation?
You typically use cross tabulation when you have categorical variables or data - e.g. information that can be divided into mutually exclusive groups.
For example, a categorical variable could be customer reviews by region. You divide this information into reviews per geographical area: North, South, East, West, or state, and then analyse the relationships between that data.
Terminology
In commercial research, the rows of a crosstab are historically referred to as stubs and the columns as banners.
What are the benefits of cross-tabulation?
As a statistical analysis method that allows categorical evaluation across a data set, cross-tabulation can help to uncover variables or multiple variables that affect a specific result or can aid in improving a specific outcome.
With the examples above, you should now have a good idea of how to cross-tabulation can be used in certain contexts to glean insights. But there are several other benefits to cross-tabulation:
- Error reduction: analysing data sets can be confusing, let alone accurately pulling insights from them. Using cross-tabulation, you can make your data sets more manageable at scale (as they simplify them and divide them into representative subgroups).
- More insights: cross-tabulation looks at the relationships between one or more categorical variables to uncover more granular insights. These insights might go unnoticed with standard approaches (or require more work to reveal).
- Actionable information: as cross-tabulation simplifies data sets and allows you to quickly compare the relationships between them, you can uncover insights faster and apply new strategies as necessary.
These are the main benefits of cross-tabulation, but as a statistical analysis method, it can be applied to a wide range of research areas and disciplines to help you get more from your data.
Cross-Tabulation With Chi-Square Analysis
The Chi-square statistic is the primary statistic used for testing the statistical significance of the cross-tabulation table. Chi-square tests determine whether or not the two variables are independent. If the variables are independent (have no relationship), then the results of the statistical test will be "non-significant" and we are not able to reject the null hypothesis, meaning that we believe there is no relationship between the variables. If the variables are related, then the results of the statistical test will be "statistically significant" and we can reject the null hypothesis, meaning that we can state that there is some relationship between the variables.
The chi-square statistic, along with the associated probability of chance observation, may be computed for any table. If the variables are related (i.e., the observed table relationships would occur with very low probability, say only 5%) then we say that the results are "statistically significant" at the .05 or 5% level.
This means that the variables have a low chance of being independent. Students of statistics will recall that the probability values (.05 or .01) reflect the researcher’s willingness to accept a type I error, or the probability of rejecting a true null hypothesis (meaning that we thought there was a relationship between the variables when there wasn’t).
Furthermore, these probabilities are cumulative, meaning that if 20 tables are tested, the researcher can be almost assured that one of the tables is incorrectly found to have a relationship (20 x .05 = 100% chance). Depending on the cost of making mistakes, the researcher may apply more stringent criteria for declaring significance, such as .01 or .005.