International ETFs
Free ETF Screener - Search and Analyze ETFs - Stock Analysis
Technology
| Index | US Domiciled ETFs | Ireland Domiciled |
|---|---|---|
| S&P 500 | VOO | CSPX / VUAA |
| S&P 500 Tech Sector | VGT | IUIT |
| Nasdaq-100 | QQQM | CNDX |
| FTSE All World Index | VT | VWRA |
CSPX vs. VUAA: The Breakdown
| Metric | CSPX (iShares Core S&P 500) | VUAA (Vanguard S&P 500) |
|---|---|---|
| Provider | BlackRock (iShares) | Vanguard |
| Total Expense Ratio | 0.07% | 0.07% |
| Dividend Policy | Accumulating | Accumulating |
| Fund Size (AUM) | ~$156 Billion (Massive) | ~$33 Billion (Very Large) |
| Launch Date | 2010 | 2019 |
| Replication Method | Physical (Buys the stocks) | Physical (Buys the stocks) |
| Current Price per Share | ~$818 | ~$144 |
For detailed analysis of tech-focused Irish ETFs: See Irish-Domiciled Tech ETFs - IUIT & CNDX
For US estate tax avoidance strategies: See US Estate Tax Avoidance for Non-Resident Aliens
For international bond/debt ETFs (short and long duration, UCITS and US-domiciled): See International Debt ETFs (IBKR + UCITS)
- https://fundrise.com/vcx
- Private Fund - Top holdings include Anthropic, Databricks, OpenAI, SpaceX, Epic Games, and so on.
- 1.85% fee
- QQQ - Invesco QQQ Trust, Series 1
- Expense Ratio - 0.20%
- Assets - $326.68B
- The Invesco QQQ Trust Series I (QQQ) is an exchange-traded fund that is based on the NASDAQ 100 index, a modified-market-cap-weighted index of 100 NASDAQ-listed stocks. QQQ was launched on Mar 10, 1999 and is issued by Invesco.
- Tracks - NASDAQ-100
- QQQ ETF Stock Price, Quote & Overview - Stock Analysis
- QQQ vs. VGT — ETF Comparison - Stock Analysis
- QQQM
- Assets - $39.37B
- Expense Ratio - 0.15%
- Launched in 2020, QQQM is a newer alternative aimed at long-term, buy-and-hold retail investors.
- Designed with a lower expense ratio than QQQ, QQQM provides the same exposure to the Nasdaq-100 but with slightly lower costs.
- QQQM is part of Invesco’s suite of “Q” products, offering a cost-effective way to gain access to high-growth, large-cap Nasdaq companies.
- QQQ vs QQQM: Choosing the Best Nasdaq-100 ETF | etf.com
- https://www.schwab.wallst.com/schwab/Prospect/research/etfs/schwabETF/index.asp?type=holdings&symbol=QQQM
- VGT - Vanguard Information Technology ETF (AGT ARCA)
- Assets - $85.55B
- Expense Ratio - 0.10%
- The Vanguard Information Technology ETF (VGT) is an exchange-traded fund that mostly invests in information technology equity. The fund tracks a market cap-weighted index of companies in the US information technology sector. VGT was launched on Jan 26, 2004 and is issued by Vanguard.
- Pure Tech - Doesn't include Amazon and Alphabet (Google)
- Tracks - NASDAQ-Composite
- VGT ETF Stock Price, Quote & Overview - Stock Analysis
- QQQ vs. VGT — ETF Comparison - Stock Analysis
- https://www.schwab.wallst.com/schwab/Prospect/research/etfs/schwabETF/index.asp?type=holdings&symbol=VGT
- Vanguard Growth ETF (VUG)
- Assets - $159.91B
- Expense Ratio - 0.04%
- The Vanguard Growth ETF (VUG) is an exchange-traded fund that is based on the CRSP US Large Growth index. The fund tracks an index of large-cap stocks in the US. Holdings are selected and weighed based on growth factors. VUG was launched on Jan 26, 2004 and is issued by Vanguard.
- VUG ETF Stock Price, Quote & Overview - Stock Analysis
- VUG vs. QQQ ETF comparison analysis | ETF Central
- Technology Select Sector SPDR Fund (XLK)
- Assets - $72.81B
- Expense Ratio - 0.09%
- Holdings - 72
- The Technology Select Sector SPDR Fund (XLK) is an exchange-traded fund that is based on the Technology Select Sector index. The fund tracks an index of S&P 500 technology stocks. XLK was launched on Dec 16, 1998 and is issued by State Street.
- XLK ETF Stock Price, Quote & Overview - Stock Analysis
- iShares Bitcoin Trust ETF (IBIT)
- Assets - $59.39B
- Expense Ratio - 0.25%
- The iShares Bitcoin Trust ETF (IBIT) is an exchange-traded fund that mostly invests in long btc, short usd currency. The fund is a passively managed fund that seeks to track the spot price of Bitcoin. IBIT was launched on Jan 5, 2024 and is issued by BlackRock.
- IBIT ETF Stock Price, Quote & Overview - Stock Analysis
- How can Indians invest in Bitcoin ETFs in the US? BitBNS' Gaurav Dahake answers
- Indian investors can profit from Bitcoin ETFs. Here’s how - appreciate
- Schwab U.S. Large-Cap Growth ETF (SCHG)
- Assets - $34.87B
- Expense Ratio - 0.04%
- The Schwab U.S. Large-Cap Growth ETF (SCHG) is an exchange-traded fund that mostly invests in large cap equity. The fund tracks the Dow Jones U.S. Large-Cap Growth Total Stock Market Index, which selects growth stocks from 750 of the largest U.S SCHG was launched on Dec 11, 2009 and is issued by Charles Schwab.
- Which Is The Best Growth ETF? (SCHG vs VUG vs QQQM) - YouTube
- Which should I add for growth? Qqqm, schg, or vug? : r/ETFs
- I Ranked The Top 10 Most Popular ETFs in the World (Tier List) - YouTube
Others
- Vanguard FTSE All-World UCITS ETF (LON:VWRA) - VWRA
- IBKR - VWRA VANG FTSE AW USDA - LSEETF
- Market Timings (Daylight Savings) in London
- in summers - March to October - 12:30 PM – 09:00 PM IST
- in winters - October to March - 01:30 PM to 10:00 PM IST
- VWRA - Stock ticker VANG - By Vanguard FTSE - Tracks the FTSE index AW - All world USDA - Trades in USD, A is an accumulation ETF
- Assets - $25.68B
- Expense Ratio - 0.19%
- Total Holdings - 3789
- PE Ratio - 23.74
- Vanguard FTSE All-World UCITS ETF is an exchange traded fund launched by Vanguard Group (Ireland) Limited. The fund is co-managed by Vanguard Asset Management, Limited and The Vanguard Group, Inc. It invests in the public equity markets across the globe. The fund seeks to invest in the stocks of companies operating across diversified sectors. It invests in the stocks of large-cap and mid-cap companies. The fund seeks to replicate the performance of the FTSE All-World Index, by investing in the stocks of companies as per their weightings in the index. It was formerly known as Vanguard Funds Public Limited Company - Vanguard FTSE All-World ETF. Vanguard FTSE All-World UCITS ETF was formed on May 22, 2012 and is domiciled in Ireland.
- https://stockanalysis.com/quote/lon/VWRA/holdings/
- SPDR S&P 500 ETF Trust (SPY)
- Assets - $624.34B
- Expense Ratio - 0.09%
- The SPDR S&P 500 ETF Trust (SPY) is an exchange-traded fund that is based on the S&P 500 index. The fund tracks a market cap-weighted index of US large- and mid-cap stocks selected by the S&P Committee. SPY was launched on Jan 22, 1993 and is issued by State Street.
- QQQ vs. SPY — ETF Comparison - Stock Analysis
- Vanguard S&P 500 ETF (NYSEARCA: VOO)
- Assets - $587.16B
- Expense Ratio - 0.03%
- The Vanguard S&P 500 ETF (VOO) is an exchange-traded fund that is based on the S&P 500 index. The fund is passively managed to hold large-cap US stocks selected by an S&P Committee. VOO was launched on Sep 7, 2010 and is issued by Vanguard.
- VOO ETF Stock Price & Overview
- Vanguard FTSE Developed Markets ETF (VEA)
- Assets - $139.70B
- Expense Ratio - 0.06%
- The Vanguard FTSE Developed Markets ETF (VEA) is an exchange-traded fund that mostly invests in total market equity. The fund is passively managed to provide exposure to the developed markets ex-US equity space. It holds stocks of any market capitalization. VEA was launched on Jul 20, 2007 and is issued by Vanguard.
- VEA ETF Stock Price, Quote & Overview - Stock Analysis
- Vanguard FTSE Emerging Markets ETF (VWO)
- The Vanguard FTSE Emerging Markets ETF (VWO) is an exchange-traded fund that mostly invests in total market equity. The fund is passively managed to provide exposure to the emerging markets equity space. It holds stocks of any market capitalization. VWO was launched on Mar 4, 2005 and is issued by Vanguard.
- VWO ETF Stock Price & Overview
- Vanguard Global Stock Index Fund (VT Index)
- Mutual-fund share class: VTWAX - Vanguard Total World Stock Index Fund (Admiral Shares, same FTSE Global All Cap Index and underlying portfolio as VT, but daily-NAV mutual fund instead of an intraday-traded ETF)
- Vanguard Total International Stock ETF (VXUS) ETF Stock Price & Overview
- MSCI World Index
- MSCI All Country World Index
- S&P Global Index
- Dow Jones Industrial Average
- The Dow Jones Industrial Average, Dow Jones, or simply the Dow, is a stock market index of 30 prominent companies listed on stock exchanges in the United States. The DJIA is one of the oldest and most commonly followed equity indexes.
- Russell 2000 Index
- The Russell 2000 Index is a small-cap U.S. stock market index that makes up the smallest 2,000 stocks in the Russell Index. It was started by the Frank Russell Company in 1984. The index is maintained by FTSE Russell, a subsidiary of the London Stock Exchange Group.
- FTSE 100 Index (London)
- DAX 30 (Germany)
- includes 40 major German blue-chip companies
- NIKKEI 225 (Japan)
- MEXI is Mexiso, LSE i London, ARCA is NYSE
- Hang Seng Index (HangSeng index)
- The Hang Seng Index is a market-capitalisation-weighted stock market index in Hong Kong, adjusted for free float. It tracks and records daily changes in the largest companies listed on the Hong Kong Stock Exchange and serves as the primary indicator of overall market performance in Hong Kong.
- SSE Composite Index (China)
- The SSE Composite Index also known as SSE Index is a stock market index of all stocks that are traded at the Shanghai Stock Exchange
- TOPT
- Assets - $171.06M
- Expense Ratio - 0.20%
- The iShares Top 20 U.S. Stocks ETF (TOPT) is an exchange-traded fund that is based on the S&P 500 Top 20 Select index. The fund seeks to mirror the performance of an index comprising the top 20 largest US firms by market-cap in the S&P 500. The companies are weighted by their float-adjusted market-cap TOPT was launched on Oct 23, 2024 and is issued by BlackRock.
- TOPT ETF Stock Price & Overview
- QTOP
- Assets - $89.43M
- Expense Ratio - 0.20%
- The iShares Nasdaq Top 30 Stocks ETF (QTOP) is an exchange-traded fund that is based on the Nasdaq-100 Top 30 index. The fund aims to track an index composed of the 30 largest companies by market-cap from the Nasdaq-100 Index. The components are weighted by market-cap with capping limits QTOP was launched on Oct 24, 2024 and is issued by BlackRock.
- QTOP ETF Stock Price & Overview
How to Invest in International Mutual Funds the right way? - YouTube
US Dividend / Value
| Metric | SCHD (Schwab US Dividend Equity) |
|---|---|
| Price | ~$30.72 |
| P/E Ratio | ~17.1x |
| Dividend Yield | ~3.1-3.4% |
| AUM | ~$85.0B |
| Expense Ratio | 0.06% |
| Holdings | 104 |
| 52-Week Range | 31.95 |
| Inception | Oct 2011 |
| 1Y / 3Y (ann.) / 5Y (ann.) / 10Y (ann.) Total Return | +27.2% / +15.3% / +10.2% / +12.9% |
Critical take: this is the single cleanest "style diversifier" for a portfolio that's otherwise all growth/momentum (QQQM/VGT/individual mega-cap tech) — it tracks a value/quality-dividend index (profitability + leverage + dividend-growth screens, not just high current yield), so it doesn't overlap with a US-tech-heavy book the way another growth fund would. The 1-year return (+27.2%) is flattered by the broad 2026 market rally and shouldn't be read as "dividend stocks are suddenly a growth play" — the 10-year (+12.9% ann.) is the more honest read on what this fund actually does over a full cycle. Cheap (0.06% TER), large and liquid ($85B AUM), no red flags.
SCHD ETF Stock Price & Overview - Stock Analysis
UCITS alternative: there is no UCITS fund that replicates SCHD's exact index (the Dow Jones US Dividend 100). The closest widely-available Ireland-domiciled equivalent is the WisdomTree US Quality Dividend Growth UCITS ETF — ticker DGRA (USD Acc, ISIN IE00BZ56RG20, ~173M AUM). Same spirit (quality + dividend-growth screen, not pure high-yield) but a different underlying index and a meaningfully higher TER (0.33% vs. SCHD's 0.06%) — treat as directionally similar, not a precise substitute, and prefer the Acc share class (DGRA) for the same tax-deferral logic as VWRA over VWRP.
Clean Energy / Solar
| Metric | TAN (Invesco Solar) | ICLN (iShares Global Clean Energy) |
|---|---|---|
| Price | ~$48.04 | ~$19.06 |
| AUM | ~$1.5-1.6B | ~$2.09B |
| Expense Ratio | 0.70% | 0.39% |
| Holdings Focus | Pure-play solar (MAC Global Solar Energy Index) | Broader clean energy (solar + wind + other, ~30 largest global names) |
| 1Y Return | +43.5% | +42.0% |
| 3Y Return (ann.) | -6.7% | +2.4% |
Critical take — read the 3-year number before the 1-year one: both funds just had a strong 12 months, but that sits inside a multi-year drawdown (TAN is still net negative annualized over 3 years despite the recent rally) — this is the textbook shape of a boom-bust thematic fund: the 2020-2021 clean-energy bubble, a brutal 2022-2024 correction, and a partial 2025-2026 recovery that hasn't yet undone the damage. Unlike VXUS/SCHD above, this is not a "safe diversifier" — it's a higher-volatility, policy-dependent satellite bet (tax-credit phaseouts and new supply-chain restrictions are live 2026 headwinds even as data-center power demand is a tailwind). If pursuing this idea at all, ICLN over TAN: broader (lower single-technology concentration), cheaper (0.39% vs 0.70%), and a less violently negative 3-year number. Size as a small satellite position, not a core holding, and go in understanding you're buying into the recovery leg of a boom-bust cycle, not a steady compounder.
ICLN ETF Overview · TAN ETF Overview
UCITS alternatives (longer track record, confirms the boom-bust read even more starkly):
| Ticker | Name | ISIN | Exchange | TER | AUM | 1Y | 3Y (ann.) | 5Y (ann.) | 10Y (ann.) | Inception |
|---|---|---|---|---|---|---|---|---|---|---|
| INRG | iShares Global Clean Energy UCITS ETF | IE00B1XNHC34 | LSE | 0.65% | ~$3.74B | +58.1% | +5.0% | -1.6% | +10.3% | Jul 2007 |
| ISUN / RAYS | Invesco Solar Energy UCITS ETF | IE00BM8QRZ79 | LSE | — | smaller, 29 holdings | — | — | — | — | — |
INRG's 19-year track record makes the boom-bust pattern unambiguous: a +10.3% 10-year annualized return sitting alongside a negative 5-year annualized return (-1.6%) means almost the entire lifetime gain was banked in one early boom phase, with the 2020-2021 bubble and subsequent crash netting out to a loss over the most recent 5 years. Note INRG's TER (0.65%) is actually higher than US-domiciled ICLN's (0.39%) — the UCITS wrapper's estate-tax benefit here comes at a real, non-trivial cost premium, worth weighing against how large a position this would be. ISUN/RAYS (Invesco's own UCITS solar fund, tracking the STOXX Global Solar Energy Index rather than TAN's MAC Global Solar index) exists as the direct UCITS sibling to TAN, but is small/less liquid — the same "ICLN/INRG over TAN/ISUN" logic from the US-domiciled comparison above applies here too.
Defensive Stocks (Non-Tech)
| ETF Name & Ticker | Sector Focus | Why It Hedges Against an AI Bust |
|---|---|---|
| iShares Global Consumer Staples (KXI) | Consumer Staples | Focuses on global companies producing food, beverages, and household items. Consumer demand for these basics remains highly stable during tech downturns. |
| iShares Global Healthcare (IXJ) | Healthcare | Provides broad geographic exposure to pharmaceuticals, biotechnology, and medical devices, all of which operate largely independently of tech hardware/software cycles. |
| iShares Global Utilities (JXI) | Utilities | Invests in global power, water, and gas providers. Utilities feature heavily regulated, fixed revenue streams and offer low volatility when growth stocks crash. |
| Vanguard Total Intl Stock (VXUS) | Broad International | While not strictly a defensive sector fund, it excludes US stocks entirely. Its technology sector weight sits at just ~19.7%, giving you broad, highly diversified global exposure if you want to bet against US tech dominance. |
| Metric | KXI (Global Staples) | IXJ (Global Healthcare) | JXI (Global Utilities) | VXUS (Vanguard Total Intl) |
|---|---|---|---|---|
| AUM (Fund Size) | ~$1 Billion | $4.13 Billion | $318 Million | $157.1 Billion¹ |
| Expense Ratio | 0.38% | 0.42% | 0.39% | 0.05% |
| Number of Holdings | ~92 | ~110 | 88 | ~8,755 |
| 1-Year Return | ~10% | 17.86% | 12.40% | ~12% |
| Beta (Volatility vs. Market) | Defensive (< 0.70) | 0.52 (Highly Defensive) | Defensive (< 0.70) | 0.92 (Tracks Ex-US Global Market) |
| Top Country Exposure | US (~50%), UK, Switzerland | US (~70%), Switzerland, Japan | US (~65%), Europe (~30%) | Japan, UK, Canada, China (0% US) |
| Liquidity / Trading Volume | High (Easy to trade) | Very High | Moderate to High | Extremely High |
Deep Dive into the Defensive Options
1. iShares Global Consumer Staples (KXI)
- The Profile: Holds the companies that make the things people buy regardless of economic conditions (toothpaste, food, beverages). Top holdings usually include Procter & Gamble, Nestlé, and Coca-Cola.
- Performance Context: It typically underperforms during massive tech bull markets but acts as a shock absorber during crashes. Its beta is significantly lower than the broader market, meaning less violent price swings.
2. iShares Global Healthcare (IXJ)
- The Profile: An exceptionally defensive sector fund driven by demographics (an aging global population) rather than economic cycles. Top holdings include Eli Lilly, Johnson & Johnson, and Novo Nordisk.
- Performance Context: With a beta of just 0.52, IXJ historically moves only half as violently as the broader market. Healthcare is one of the few sectors that offers both defensive stability and strong growth (due to pharma and biotech innovations).
3. iShares Global Utilities (JXI)
- The Profile: The ultimate "boring" investment. It holds power, gas, and water companies globally. Because these companies operate as local monopolies with highly regulated pricing, their revenues are incredibly stable.
- Performance Context: JXI acts almost like a bond equivalent. Capital appreciation is usually slow, but it pays out higher, consistent dividends. Note: It is the smallest fund of the four ($318M AUM), though still perfectly liquid for a retail investor.
4. Vanguard Total International Stock (VXUS)
- The Profile: A massive, ultra-cheap (0.05% expense ratio) fund that owns almost every investable publicly traded company outside the United States (nearly 9,000 stocks).
- Performance Context: It is not purely "defensive" in the way utilities are; rather, it is a geographic hedge. It protects you from US-specific overvaluations and the dominance of the US tech giants.
- ¹ AUM data quality note (Oct 2026): a separate web lookup returned 157.1B above) — that figure is almost certainly wrong (it would make VXUS larger than
SPYat 157.1B as the more reliable figure; re-verify against vanguard.com or stockanalysis.com directly before relying on either for a sizing decision.
UCITS ETF Comparison vs. VWRA
| Metric | VWRA (Your Current Core) | WCSD (Global Staples) | CBUR (Global Healthcare) | WUTI (Global Utilities) | XUSE (World ex-USA) |
|---|---|---|---|---|---|
| Strategy | Broad Global Equities | Essential Goods / Food | Big Pharma / Biotech | Regulated Power/Water | Broad Global (Excluding US) |
| Tech Exposure | ~25% | 0% | 0% | 0% | ~9.7% |
| Expense Ratio | 0.22% | 0.18% | 0.18% | 0.30% | 0.15% |
| AUM (Fund Size) | ~$25 Billion | ~$104 Million | €309 Million | €45 Million | $3.5 Billion |
| Number of Holdings | ~3,700 | 80 | ~80 | ~65 | 751 |
| 1-Year Return (Appx) | ~20% | ~6% | 18% | ~10-12% | ~12-15% |
| Beta (Volatility vs Market) | 1.00 (The Benchmark) | ~0.70 (Defensive) | ~0.75 (Defensive) | ~0.55 (Highly Defensive) | ~0.90 (Slightly less volatile) |
| Top 3 Countries | US (62%), Japan, UK | US (50%), UK, Switzerland | US (66%), Swiss, UK | US (60%), UK, Spain | Japan, UK, Canada (0% US) |
| Liquidity on LSE | Exceptionally High | Good / Moderate | High | Moderate | Very High |
Detailed Breakdown of the Alternatives
1. iShares MSCI World Consumer Staples Sector (LSE Ticker: WCSD)
- The Profile: This fund holds companies like Costco, Procter & Gamble, Coca-Cola, and Nestlé. It is an accumulating fund that tracks the defensive consumer staples sector.
- Why it hedges AI: People do not stop buying toothpaste, groceries, or baby formula during a recession or a tech crash. While its 1-year return is lower than tech, it generates steady cash flows and acts as a shock absorber.
- Important Note: The beta is low, meaning it rarely suffers the violent 20-30% drawdowns that the tech sector experiences.
2. iShares MSCI World Health Care Sector (LSE Ticker: CBUR)
- The Profile: This fund holds global giants like Eli Lilly, Johnson & Johnson, Novartis, and AstraZeneca.
- Why it hedges AI: Healthcare is unique because it is both defensive (people always need medicine) and capable of high growth (via breakthrough drugs, like GLP-1 weight-loss medications). It has delivered an impressive ~18% return over the last year without relying on semiconductors or software.
- Important Note: It has a relatively high concentration in its top holdings (e.g., Eli Lilly makes up ~11% of the fund) due to the massive market cap of modern pharma companies.
3. SPDR MSCI World Utilities UCITS ETF (LSE Ticker: WUTI)
- The Profile: Invests in heavily regulated power, water, and gas networks globally.
- Why it hedges AI: Utilities are essentially "bond proxies." They have heavily regulated, guaranteed revenues. When hyper-growth sectors crash, scared capital usually flees into utilities for safety.
- Important Note: This is the smallest fund on the list (€45M AUM). While perfectly safe to trade, you may see slightly wider bid-ask spreads on IBKR compared to massive funds like VWRA. Use limit orders when buying.
4. iShares MSCI World ex-USA UCITS ETF (LSE Ticker: XUSE)
- The Profile: This is a massive $3.5 Billion fund that completely strips the United States out of the equation. Its top holdings include ASML (Europe), HSBC (UK), Toyota (Japan), and Royal Bank of Canada.
- Why it hedges AI: The AI boom is overwhelmingly a US-centric phenomenon. By removing the US, XUSE's technology sector weight drops to roughly 9.7%. Instead, it leans heavily into Financials (28%) and Industrials (17%), giving you true geographic diversification away from Silicon Valley.
VWRA vs. VUAA (S&P 500 - VOO UCITS Alternative)
| Metric | VUAA (S&P 500 UCITS) | VWRA (FTSE All-World UCITS) |
|---|---|---|
| Geographic Exposure | 100% United States | ~62% US / 38% International |
| Number of Holdings | ~500 | ~3,700 |
| International Diversification | 0% | Japan, UK, India, Taiwan, China, etc. |
| Total Expense Ratio | 0.07% | 0.14% |
| "Hidden" Tech/AI Exposure | Extreme (~45-50% effective) | High, but diluted globally |
Irish Domiciled (UCITS) ETFs
Domiciled outside US - Replacing VOO, QQQ & VT with CSPX, SXRV & VWRA
- VWRA - Vanguard FTSE All-World UCITS ETF USD Acc
You must strictly buy the Accumulating version. This ensures dividends are reinvested inside the fund automatically. You never receive cash in your bank account, so you generally don't trigger "Dividend Income" tax in India each year.
Top 3 "Buy & Forget" Global ETFs (LSE Listed)
These trade on the London Stock Exchange (LSE) but are denominated in USD.
| Feature | 1. VWRA (The Gold Standard) | 2. ISAC (The Challenger) | 3. IWDA / SWDA (Developed Only) |
|---|---|---|---|
| Full Name | Vanguard FTSE All-World UCITS ETF (Acc) | iShares MSCI ACWI UCITS ETF (Acc) | iShares Core MSCI World UCITS ETF (Acc) |
| Ticker | VWRA | ISAC (or SSAC) | IWDA (or SWDA) |
| Provider | Vanguard | BlackRock (iShares) | BlackRock (iShares) |
| What it buys | Whole World (Developed + Emerging Markets) | Whole World (Developed + Emerging Markets) | Developed Markets Only (US, UK, Japan, etc. — No India/China) |
| No. of Stocks | ~3,700 | ~2,400 | ~1,500 |
| Expense (TER) | 0.22% | 0.20% | 0.20% |
| Fund Size | Huge (High Liquidity) | Large | Massive |
| Dividend Policy | Accumulating (Reinvested) | Accumulating (Reinvested) | Accumulating (Reinvested) |
Which one should you pick?
Option A: The "One-Stop Shop" (Recommended)
Choose: VWRA (Vanguard) or ISAC (iShares).
- Why: These two are almost identical. They cover the entire planet. You get exposure to the US (Apple, Microsoft), Europe, plus Emerging Markets (China, India, Brazil) in one single ticker.
- The slight edge:
VWRAis often preferred by the "FIRE" (Financial Independence) community because it tracks the FTSE All-World index, which includes slightly more medium/small-cap companies than the MSCI ACWI index used by ISAC.
Option B: The "Developed Markets Only"
Choose: IWDA (iShares).
- Why: If you believe Emerging Markets (like India/China) are risky or will underperform, you buy this. It invests only in developed economies (mostly USA, Japan, Europe).
- The Trap: If you live in India, you are already heavily exposed to the Indian economy (your job, your house, your rupees). Many investors skip Emerging Markets in their global portfolio to avoid "doubling down" on risk. However, for a true "global citizen" strategy, Option A is safer.
Critical "How-To" for Interactive Brokers (IBKR)
When you search for these on IBKR, you will see multiple versions (listing on different exchanges like LSE, AEB, EBS).
You must select the correct one to ensure liquidity and USD currency:
- Search Ticker: Type
VWRA. - Select Exchange: Choose LSE (London Stock Exchange).
- Currency: Ensure it says USD.
- Note: You might see
VWRP(same fund, but in GBP). Do not buy that unless you hold Pounds. You wantVWRA(USD) to match the dollars you sent via LRS.
- Note: You might see
International Stocks
- Taiwan Semiconductor Manufacturng Co Ltd (TPE: 2330)
- Samsung Electronics Co Ltd (KRX: 005930)
- BYD Co Ltd (SEHK: 1211 / OTC unsponsored ADR: BYDDY, 1 ADR = 2 H-shares)
- Price ~HK81.80 - HK$159.27
- P/E ~21-27x depending on source — above the Asian auto industry average (~21.6x) and well above the broader peer average (~9.9x); a DCF model instead suggests undervaluation vs. estimated future cash flows — genuinely mixed signal, not a clean "cheap" or "expensive" call
- Access: either the actual H-share (1211.HK — needs HKEX trading permissions enabled on IBKR) or the US OTC ADR
BYDDY(unsponsored — BYD doesn't support it with financials, thinner liquidity, price can lag the HK line). Prefer the HK listing if permissions allow. - Not VIE-structured (unlike e.g. Alibaba) so carries less of the China-ADR delisting/VIE risk premium specifically, but still carries general HK/China geopolitical and currency risk
- MercadoLibre Inc (NASDAQ: MELI) — LatAm e-commerce + fintech
- Price ~2,614 (Jun 2025) — currently ~30% below ATH
- P/E ~49x — not cheap despite being well off its high; revenue growth ~39% YoY is what's funding that multiple
- Critical take: good business, but "down 30% from its ATH" and "statistically cheap" are different claims — at 49x earnings this is a quality-growth name trading at a smaller premium, not a value opportunity
Difference
VGT vs QQQM
The primary difference between VGT (Vanguard Information Technology ETF) and QQQM (Invesco NASDAQ 100 ETF) is their sector concentration: VGT is a pure-play technology fund, while QQQM is a diversified growth fund that includes non-tech sectors like consumer services and healthcare.
| Feature | VGT (Vanguard Info Tech) | QQQM (Nasdaq 100) |
|---|---|---|
| Expense Ratio | 0.10% (Lower) | 0.15% |
| Holdings | ~310–320 stocks | ~100–106 stocks |
| Tech Exposure | ~98% (Pure Tech) | ~51–56% |
| Top Holding | Nvidia (~17.5%) | Nvidia (~9.0%) |
| Dividend Yield | ~0.39% | ~0.49% |
| Doesn't have AMZN, GOOG | Have AMZN, GOOG |
Nasdaq Composite vs Nasdaq 100
The composition of the NASDAQ Composite is heavily weighted towards companies in the information technology sector. The Nasdaq-100, which includes 100 of the largest non-financial companies in the Nasdaq Composite, accounts for about 80% of the index weighting of the Nasdaq Composite.
- The primary difference is that the Nasdaq Composite tracks nearly all stocks listed on the Nasdaq exchange, while the Nasdaq 100 is a concentrated subset of the largest 100 non-financial companies.
- Amazon (AMZN) is not in the VGT
- VGT also excludes other major companies often considered tech, such as Alphabet (Google) and Meta (Facebook), which are classified under Communication Services.
- Buy QQQM instead of VGT
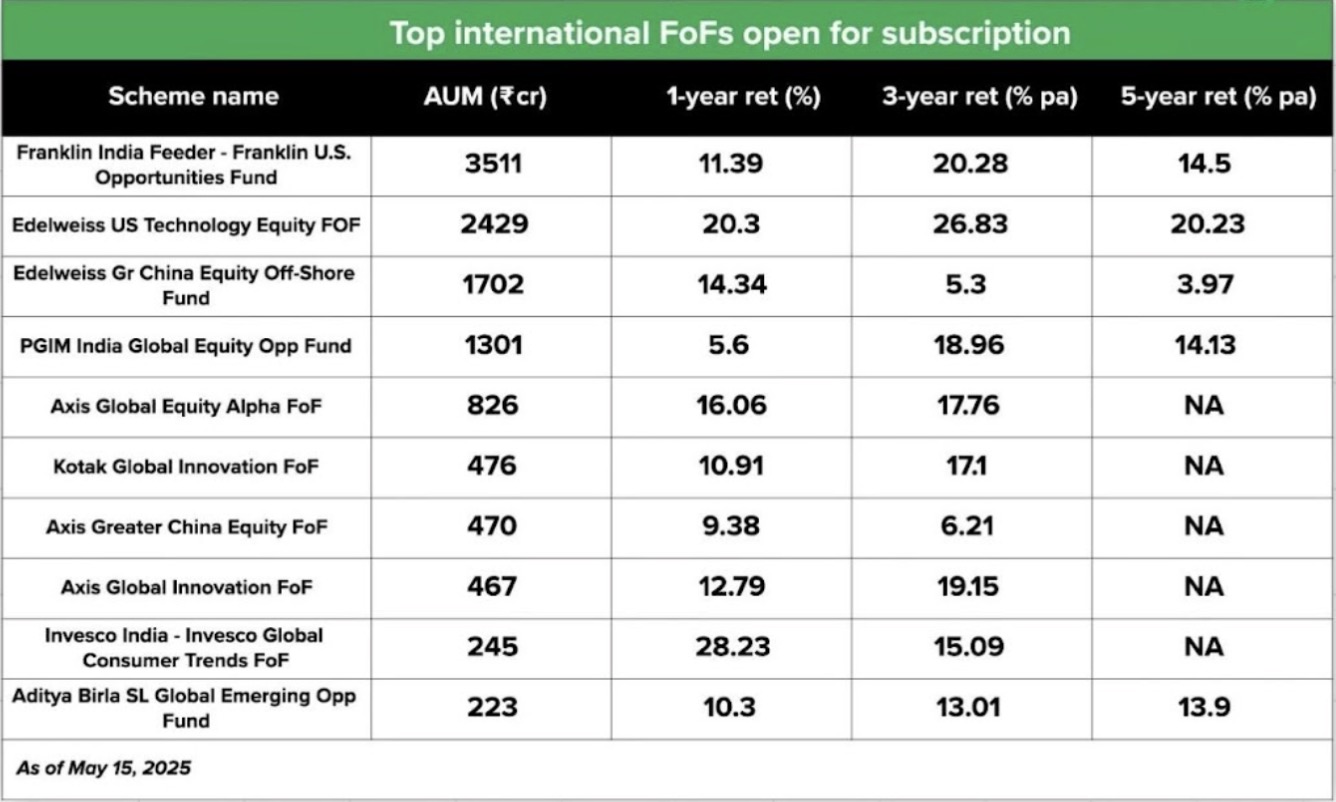
Indian International ETFs
- Mon100
- How To Cash In On China & Hong Kong’s Market Surge I Investing In China Market - YouTube
- How to use fund of funds (FOFs) to your advantage | 5 ways they can help you - YouTube
- Parag Parikh IFSC S&P 500 FOF and Parag Parikh IFSC Nasdaq 100 FOF
- Parag Parikh IFSC S&P 500 and Nasdaq 100 FoFs Open - should you invest?
- minimum investment of 5000 USD and a 500 USD top-up
- FOF route may be easier than the broker route
- we do not recommend using the Nasdaq 100 product, as it is a sectoral fund and significantly riskier than the S&P 500
Others
KOSPI and KOSDAQ
The KOSPI and KOSDAQ are the two primary stock market indices in South Korea, each representing different segments of the nation's economy.
KOSPI (Korea Composite Stock Price Index)
- Main Board: It is the primary benchmark for the Korea Exchange (KRX) and is often compared to the U.S. S&P 500.
- Blue-Chip Focus: It tracks large-cap, well-established "chaebols" (conglomerates) like Samsung Electronics, SK Hynix, and Hyundai Motors.
- Calculation: It uses a free-float market-capitalization-weighted method, meaning larger companies have a more significant impact on the index.
- KOSPI 200: A popular subset consisting of the 200 largest and most liquid companies, representing roughly 70% of the market's total value.
KOSDAQ (Korea Securities Dealers Automated Quotation)
- Secondary Market: Launched in 1996 as South Korea’s equivalent to the U.S. Nasdaq, it serves as a springboard for innovation.
- Growth Focus: It is tech-heavy and dominated by small-to-medium-sized enterprises (SMEs), particularly in IT, biotech, and entertainment.
- Higher Volatility: The KOSDAQ generally experiences higher volatility and higher valuation multiples (PER) compared to the more stable KOSPI.
- Investor Base: Historically tilted toward retail traders rather than institutional or foreign investors.
EWY - iShares MSCI South Korea ETF
- Assets - $22.72B
- Expense Ratio - 0.59%
- Dividend Yield - 1.27%
- PE Ratio - 17.12
- Total Holdings - 91
- Tracks - MSCI Korea 25-50 Index (market cap-weighted index of large- and mid-cap Korean firms)
- Launched May 9, 2000; issued by BlackRock
- The primary US-listed vehicle for direct exposure to the KOSPI (above) — heavily concentrated in the same chaebol names: Samsung Electronics (21.33%) and SK hynix (20.12%) alone make up over 41% of the fund, with the top 10 holdings (SK Square, KB Financial, Samsung Electro-Mechanics, Shinhan Financial, Hyundai Motor, Hana Financial, Celltrion) at 60.69%
- See also: KOSPI Index - Comprehensive Analysis
- EWY ETF Stock Price & Overview - Stock Analysis