Understanding Boot Process Steps
Boot
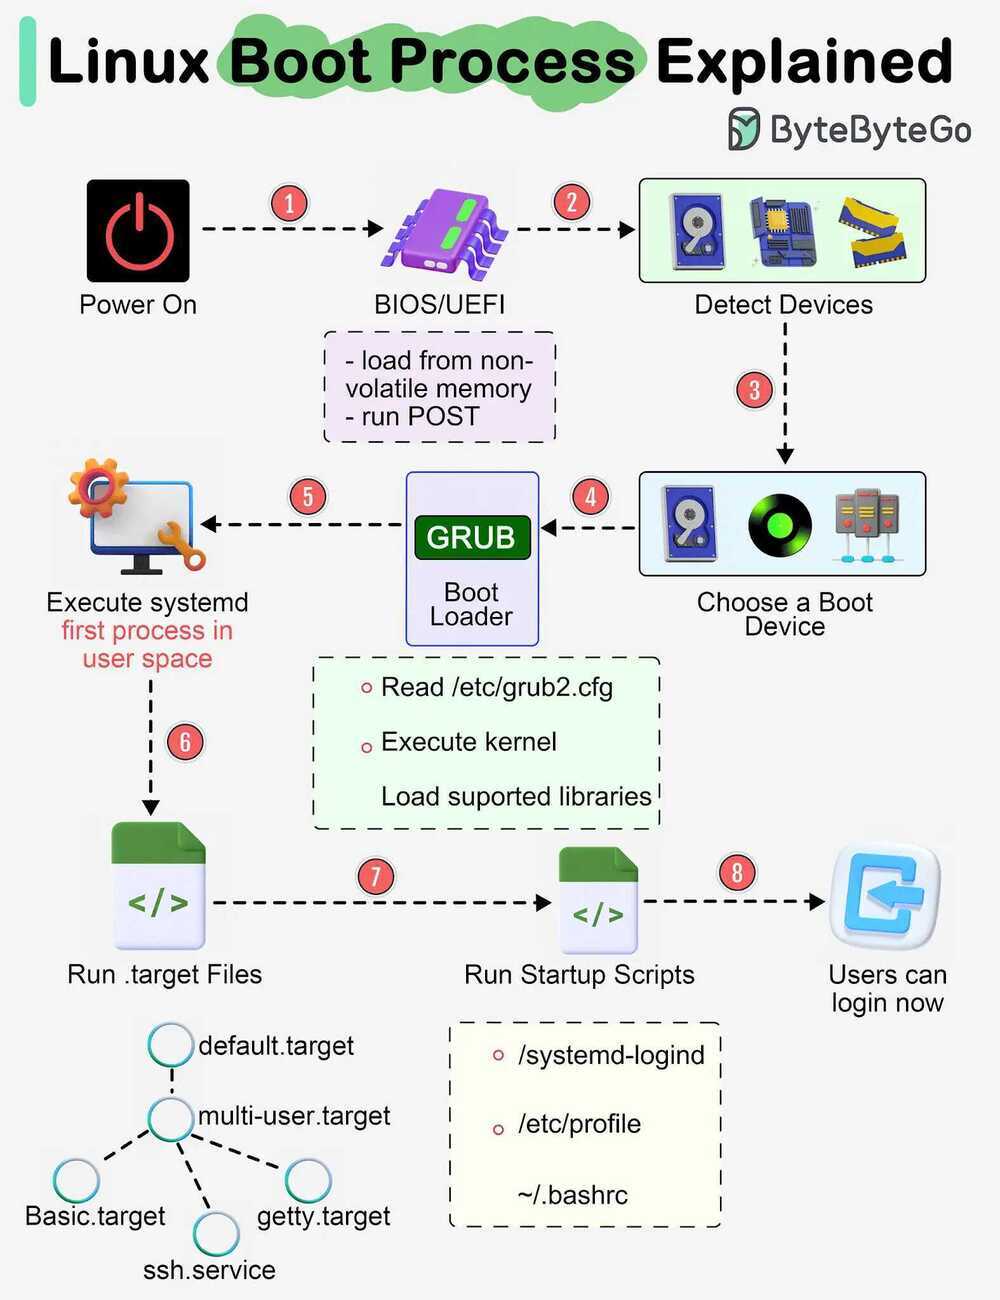
- When we turn on the power, BIOS (Basic Input/Output System) or UEFI (Unified Extensible Firmware Interface) firmware is loaded from non-volatile memory, and executes POST (Power On Self Test).
- BIOS/UEFI detects the devices connected to the system, including CPU, RAM, and storage.
- Choose a booting device to boot the OS from. This can be the hard drive, the network server, or CD ROM.
- BIOS/UEFI runs the boot loader (GRUB), which provides a menu to choose the OS or the kernel functions.
- After the kernel is ready, we now switch to the user space. The kernel starts up systemd as the first user-space process, which manages the processes and services, probes all remaining hardware, mounts filesystems, and runs a desktop environment.
- systemd activates the default. target unit by default when the system boots. Other analysis units are executed as well.
- The system runs a set of startup scripts and configure the environment.
- The users are presented with a login window. The system is now ready.
GRUB2
GRUB2 (GRand Unified Bootloader version 2) is the standard boot manager for most modern Linux distributions. When you turn on your computer, GRUB2 initializes, displays an operating system selection menu (if you dual-boot), and loads the kernel to start your system.
Configuration and Management
The most important rule of managing GRUB2 is to never edit the main configuration file directly. Instead, you edit your preferences in a designated configuration file and tell GRUB2 to programmatically generate the main file for you.
Key Locations
- /etc/default/grub: The main file where you configure settings like the timeout duration and default OS.
- /etc/grub.d/: A directory containing template scripts executed in alphanumeric order to build the boot menu.
- /boot/grub/grub.cfg (or /boot/grub2/grub.cfg): The main, read-only configuration file.
Basic Workflow for Making Changes
- Open the
/etc/default/grubfile in a text editor (likenano) using root/administrator privileges. - Modify variables as needed (e.g., changing
GRUB_TIMEOUT=5orGRUB_DEFAULT=0). - Save the file and generate the updated menu using the appropriate command for your operating system.
systemd / initd
systemd is a collection of tools for a range of different tasks.Its primary purpose is initializing, managing and tracking system services and daemons in Fedora, both during startupand while the system is running.
The init system is the first process started on Fedora after the kernel starts. In fact, the init system always gets the Process ID (PID) of 1 on a system. This process is always executed by the Linux kernel after the early stages of boo tup are completed by the BIOS and bootloader (GRUB).
The init system then must start all the necessary daemons, background processes and services required to make the operating system work. Examples of such processes include starting up a bootscreen, various parts of the networking stack, and hardware in your machine.
Often these processes continue to run in the background after they start, and are calleddaemons.These daemonsmanage many parts of your system, such as logging information, watching for devices you insert or remove, and managing user login.
https://fedoramagazine.org/what-is-an-init-system
systemctl
systemctl list-units | grep .service
systemctl status ssh.service
systemctl --failed
systemctl is-enabled ssh
systemctl reboot
systemctl poweroff
systemctl suspend
sudo systemctl start ssh.service
sudo systemctl stop ssh.service
sudo systemctl restart ssh.service
sudo systemctl disable ssh.service #will not run automatically on next startup
sudo systemctl enable ssh.service
Journald
Journald replaces the plain text files of syslog with a binary format that:
- Allows for log messages with multiple fields and multi-line text
- Stores these messages in a space-efficient way that does not require renaming files for maintenance
- Gives fast access to messages given specific criteria, much like a database would
Commands
- journalctl #view blob messages
- journalctl -a #view decoded messages
- journalctl -k #view kernel messages
- journalctl -f #follow messages
- journalctl -b #messages from this boot
- journalctl --since "2015-06-26 23:15:00" --until "2015-06-26 23:20:00"
- journalctl --since "2 days ago"
- journalctl --since "1 hour ago"
- journalctl -u nginx.service #only show nginx.service unit logs
bashplotlib
pip install bashplotlib #graphs in the console
jq
jq is like sed for JSON data - you can use it to slice and filter and map and transform structured data with the same ease that sed, awk, grep and friends let you play with text.
brew install jq

jq '.accounts[] | select(.userID == "77925937-d719-4ff6-9125-a9199ab6a9b6")' merkle_2023-04-01_2.json
fq
jq for binary formats - tool, language and decoders for working with binary and text formats
Networking - socat
socat is a command line based utility that establishes two bidirectional byte streams and transfers data between them. Because the streams can be constructed from a large set of different types of data sinks and sources (see address types), and because lots of address options may be applied to the streams, socat can be used for many different purposes
http://www.dest-unreach.org/socat/doc/socat.html
Networking - tshark
Dump and analyze network traffic
https://www.wireshark.org/docs/man-pages/tshark.html
Logrotate
logrotate is designed to ease administration of systems that generate large numbers of log files. It allows automatic rotation, compression, removal, and mailing of log files. Each log file may be handled daily, weekly, monthly, or when it grows too large.
Config file - /etc/logrotate.conf
Options - man logrotate.conf
Example
/tmp/email.log {
    compress
    delaycompress
    daily
    create 666 ubuntu syslog
    missingok
    rotate 14
}

/var/log/access.log {
    compress
    delaycompress
    daily
    create 666 root root
    missingok
    rotate 14
}
Manually trigger logrotate
sudo logrotate -f /etc/logrotate.conf
File watchers (uses this to know how to see changes to a file)
- inotify
- poll
The biggest difference is that epoll can be used for ANY fd. This means it's good for watching all types of ways to communicate data. Sockets, IPC, files, printers.. anything. inotify is for filesystems only.
However, because inotify is specific to filesystems, you can receive notifications on a wide array of filesystem-specific attributes, such as file attributes and the file being read. These things are not possible via epoll.
In fact, inotify returns a file descriptor - which means you can use epoll to determine which inotify FD's you should call read on. So the two go hand in hand to some extent.
http://en.wikipedia.org/wiki/Inotify
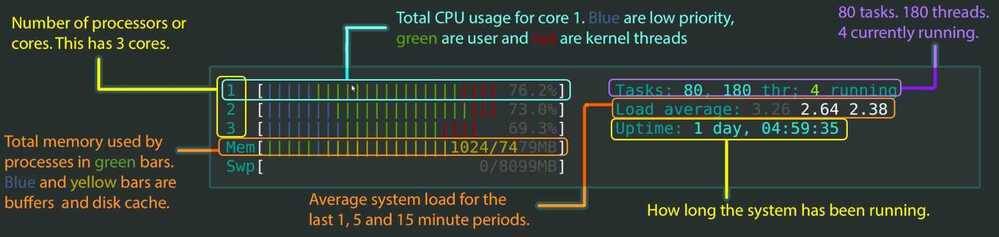
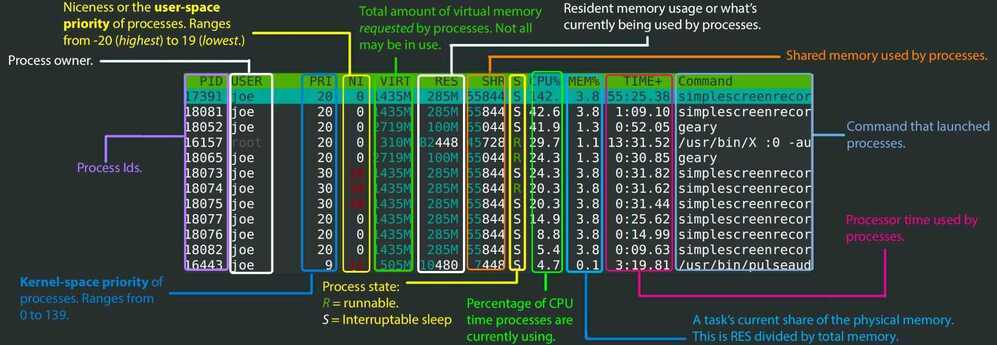
htop
htop - an interactive process viewer for Unix.
It shows a frequently updated list of the processes running on a computer, normally ordered by the amount of CPU usage. Unlike top, htop provides a full list of processes running, instead of the top resource-consuming processes. htop uses color and gives visual information about processor, swap and memory status.
https://peteris.rocks/blog/htop
How CPU Efficient is your App? - YouTube
glances
Glances is a cross-platform monitoring tool which aims to present a large amount of monitoring information through a curses or Web based interface. The information dynamically adapts depending on the size of the user interface.
pip install glances

pip install 'glances [action, browser, cloud, cpuinfo, docker, export, folders, gpu, graph, ip, raid, snmp, web, wifi]'

glances -w
https://github.com/nicolargo/glances
Interactive Filter
Searching the command history can be tedious. While both bash and zsh feature Ctrl+R keybinding, it only shows one substitution at a time. What is more, you need to enter the exact text that you used before. Since this is quite a common operation, once you start using the command line, it looks like a fine place for improvement.
Interactive filters, like fzy ⭐ 3.3k, percol ⭐ 3.3k, peco ⭐ 7.9k or fzf ⭐ 81k help you with filtering long lines of text. This can either be the aforementioned command history, all the lines of code in a project directory, or a list of filenames generated byfind .. The general idea here is to present you first with all the lines available and then rely on fuzzy finding algorithms to filter out everything that doesn't match.
For example, binding Ctrl+R to fzf shows you a list of the most recent commands, which you can navigate up and down using arrows, or you can typegitto only show commands that feature Git somewhere inside.
Plus, you can make your interactive filter available inside your programmable text editor. This way, you will have unified searching capabilities between your shell and your editor.
Big Data Terminal Tools
Pipe Viewer (pv)
Terminal-based tool for monitoring the progress of data through a pipeline. It can be inserted into any normal pipeline between two processes to give a visual indication of how quickly data is passing through, how long it has taken, how near to completion it is, and an estimate of how long it will be until completion.
GitHub - a-j-wood/pv: Pipe Viewer - monitor the progress of data through a pipe ⭐ 179
a-j-wood/pv: Pipe Viewer - monitor the progress of data through a pipe. - Codeberg.org
Parallel
brew install pv
brew install parallel

pv abc.sql | parallel --pipe --block 10M grep -o "text_string" > output.txt

pv abc.sql.gz | parallel --pipe --block 10M zgrep -o "text_string" > output.txt