Understanding Graphite Architecture
Graphite does two things
-
Store numeric time-series data
-
Render graphs of this data on demand
Architecture
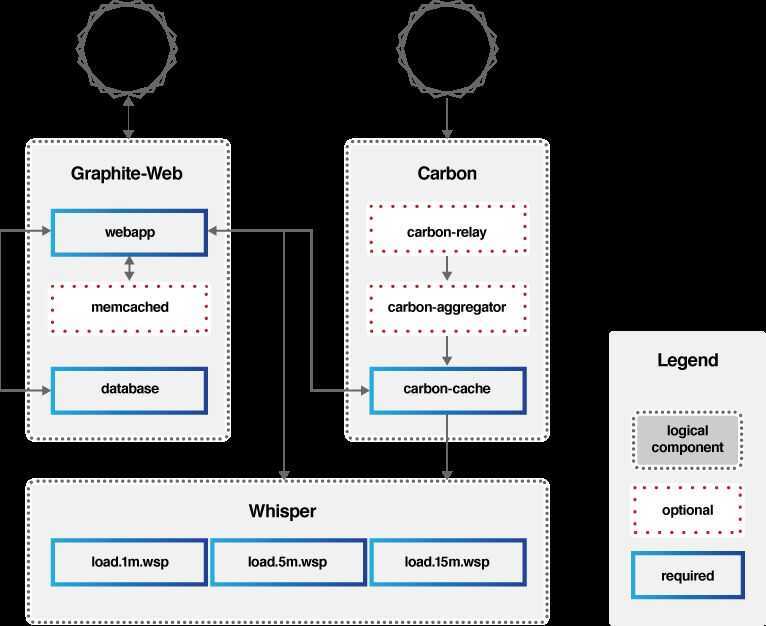
Graphite consists of three software components:
-
carbon
- a high-performance service that listens for time-series data
- a Twisted daemon that listens for time-series data
-
whisper
- a simple database library for storing time-series data (similar in design to RRD)
-
graphite-web
Metrics get fed into the stack via the Carbon service, which writes the data out to Whisper databases for long-term storage. Users interact with theGraphite webUI or API, which in turn queries Carbon and Whisper for the data needed to construct the requested graphs.
Graphite's web platform offers a variety of output styles and formats, including raw images, CSV, XML, and JSON, allowing anyone to easily embed custom graphs in other web pages or dashboards.
Points
https://graphite.readthedocs.io/en/latest/faq.html
https://grafana.com/oss/metrictank
Metrictank is a multi-tenant timeseries platform for Graphite