CheatSheet
https://www.kaggle.com/grroverpr/pandas-cheatsheet
df # A pandas DataFrame object

s # A pandas Series object

pd.options.display.max_columns = None
pd.options.display.max_rows = None
pd.options.display.max_rows = 100
Importing data
pd.read_csv(filename) # From a CSV file
pd.read_table(filename) # From a delimited text file (like TSV)
pd.read_excel(filename) # From an Excel file
pd.read_sql(query, connection_object) # Reads from a SQL table/database
pd.read_json(json_string) # Reads from a JSON formatted string, URL or file
pd.read_html(url) # Parses an html URL, string or file and extracts tables to a list of dataframes
pd.read_clipboard() # Takes the contents of your clipboard and passes it to read_table()
pd.DataFrame(dict) # From a dict, keys for columns names, values for data as lists
Exporting data
df.to_csv(filename) # Writes to a CSV file
df.to_excel(filename) # Writes to an Excel file
df.to_sql(table_name, connection_object) # Writes to a SQL table
df.to_json(filename) # Writes to a file in JSON format
df.to_html(filename) # Saves as an HTML table
df.to_clipboard() # Writes to the clipboard
Create test objects
Useful for testing
pd.DataFrame(np.random.rand(20,5)) # 5 columns and 20 rows of random floats
pd.Series(my_list) # Creates a series from an iterable my_list
df.index = pd.date_range('1900/1/30', periods=df.shape[0]) # Adds a date index
Viewing/inspecting data
df.head(n) # First n rows of the DataFrame
df.tail(n) # Last n rows of the DataFrame
df.shape() # Number of rows and columns
df.info(verbose=True) # Index, Datatype and Memory information
df.describe() # Summary statistics for numerical columns
    df.describe().apply(lambda x: format(x, 'f')) # remove scientific notation
df.columns.values
df['loan_staus].unique()
s.value_counts(dropna=False) # Views unique values and columns
df.apply(pd.Series.value_counts) # Unique values and counts for all columns
Selection
df[col] # Returns column with label col as Series
df[col1, col2] # Returns Columns as a new DataFrame
s.iloc[0] # Selection by position
s.loc[0] # Selection by index
    df.loc[:, ['earliest_cr_line', 'earliest_cr_line_date', 'mnths_since_earliest_cr_line']][df['mnths_since_earliest_cr_line'] < 100]
df.iloc[0,:] # First row
df.iloc[0,0] # First element of first column
df.isin(['a','b','c'])
np.where(condition, value if true, value if false)
    Checks if a condition is true, returns a specifed value if the condition is true or another specified value if the condition is false
    df['good_bad'] = np.where(df['loan_status'].isin(['Charged Off',
                                                        'Late (31-120 days)',
                                                        'Does not meet the credit policy. Status:Charged Off',
                                            'Default']), 0, 1)
Data cleaning
df.columns = ['a','b','c'] # Renames columns
pd.isnull() # Checks for null values, Returns Boolean Array
pd.notnull() # Opposite of s.isnull()
df.dropna() # Drops all rows that contain null values
df.dropna(axis=1) # Drops all columns that contain null values
df.dropna(axis=1,thresh=n) # Drops all rows have less than n non null values
df.fillna(s.mean()) # Replaces all null values with the mean (mean can be replaced with almost any function from the statistics section)
s.astype(float) # Converts the datatype of the series to float
s.replace(1, 'one') # Replaces all values equal to 1 with 'one'
s.replace([1,3],['one','three']) # Replaces all 1 with 'one' and 3 with 'three'
df.rename(columns=lambda x: x+1) # Mass renaming of columns
df.rename(columns={'old_name': 'new_name'}) # Selective renaming
df.set_index('column_one') # Changes the index
df.rename(index=lambda x: x+1) # Mass renaming of index
Conversions
pd.to_numeric(df['col_name']
pd.to_datetime(df['col_name'])
pd.get_dummies(df['grade'], prefix='grade', prefix_sep = ':')
Filter, sort & groupby
df[df[col] > 0.5] # Rows where the col column is greater than 0.5
df[(df[col] > 0.5) & (df[col] < 0.7)] # Rows where 0.7 > col > 0.5
df.sort_values(col1) # Sorts values by col1 in ascending order
df.sort_values(col2, ascending=False) # Sorts values by col2 in descending order
df.sort_values([col1, col2], ascending=[True,False]) # Sorts values by col1 in ascending order then col2 in descending order
df.groupby(col) # Returns a groupby object for values from one column
df.groupby([col1, col2]) # Returns a groupby object values from multiple columns
df.groupby(col1)[col2].mean() # Returns the mean of the values in col2, grouped by the values in col1 (mean can be replaced with almost any function from the statistics section)
df.pivot_table(index=col1, values=[col2,col3],aggfunc=mean) # Creates a pivot table that groups by col1 and calculates the mean of col2 and col3
df.groupby(col1).agg(np.mean) # Finds the average across all columns for every unique column 1 group
df.apply(np.mean) # Applies a function across each column
df.apply(np.max,  axis=1) # Applies a function across each row
Join/Combine
df1.append(df2) # Adds the rows in df1 to the end of df2 (columns should be identical)
pd.concat([df1, df2], axis=1) # Adds the columns in df1 to the end of df2 (rows should be identical)
df1.join(df2, on=col1, how='inner') # SQL-style join the columns in df1 with the columns on df2 where the rows for col have identical values. how can be one of 'left', 'right', 'outer', 'inner'
Statistics
These can all be applied to a series as well
df.mean() # Returns the mean of all columns
df.corr() # Returns the correlation between columns in a DataFrame
df.count() # Returns the number of non-null values in each DataFrame column
df.max() # Returns the highest value in each column
df.min() # Returns the lowest value in each column
df.median() # Returns the median of each column
df.std() # Returns the standard deviation of each column
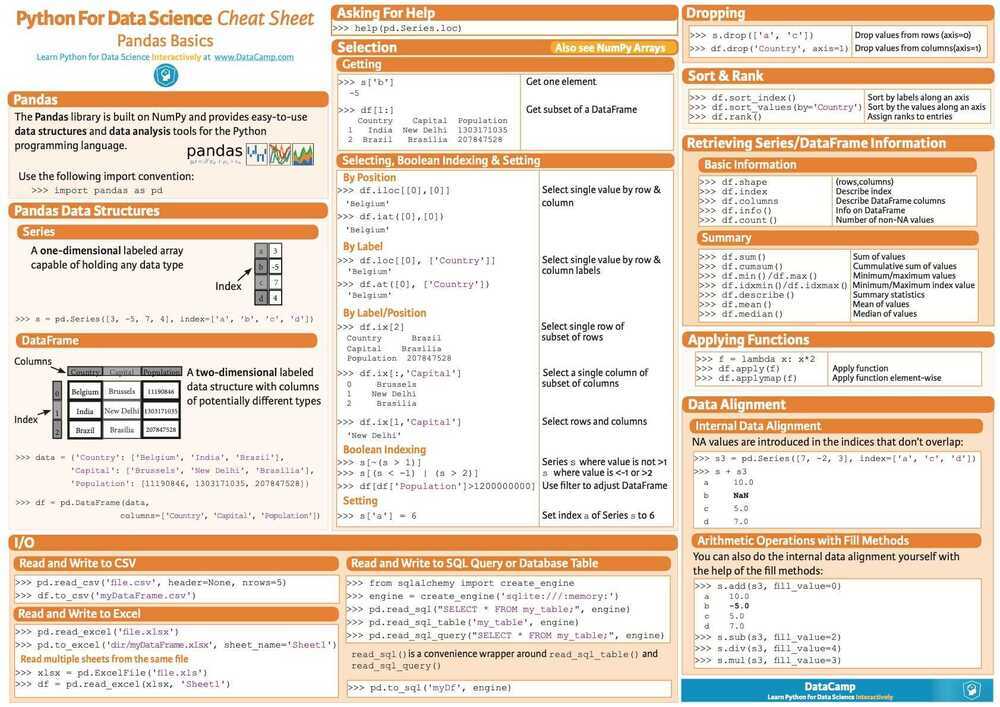
The pandas library is built on NumPy and provides easy-to-use data structures and data analysis tools for the Python programming language.
Series
A one-dimensional labeled array capable of holding any data type
s = pd.Series([3,-5,7,4], index=['a','b','c','d'])
DataFrame
A two-dimensional labeled data structure with columns of potentially different types