Climate Change
Earth overshoot day - 27 July
International Relations this Week by Prof Pushpesh Pant 36 | For UPSC/IAS - YouTube The Uninhabitable Earth
This CAN'T be true... Minute Earth
- Packaging might be more environment friendly than non packaged food
- Floating offshore wind farms can make living closer to shore better, since water problem can be solved by desalination
Why sharks matter - with David Shiffman - YouTube
El Niño 2023 could be a monster! - YouTube
The Broken Economics of the Oceans - YouTube
Finshots Recap - The best stories on climate change
What the Fossil Fuel Industry Doesn't Want You To Know | Al Gore | TED - YouTube
What Will Our World Look Like at 4 Degrees? - YouTube
Environmental Sciences
https://www.pmfias.com/carbon-nitrogen-phosphorus-sulphur-cycle
AQI / Air Quality / Air Pollution
- Why India's Air is So Deadly (And Getting Worse!) | Dhruv Rathee - YouTube
- The smog cloud affecting south Asia is now so big it can be seen from space.
- How This Couple Defeated Toxic Air Pollution To Breathe 'Mountain Air' While Staying In Delhi - YouTube
- Delhi's Air Quality Readings Top 1,700 as Residents Choke | Vantage With Palki Sharma - YouTube
- आज भी AQI 500 है, कहां भाग कर जाएं लोग, दूसरे शहर भी बेहाल - YouTube
- क्या होगा इस हवा का? | Air Pollution in North India - YouTube
- What’s Choking Indian Cities To Death? | Reality of Diwali & Pollution In India | Akash Banerjee - YouTube
- Your Family is at Risk: Harmful Gases from Kitchen, Walls & Car | BreatheEasy | FO426 Raj Shamani - YouTube
- Cleanest air quality 2025: World's top 10 cities with best air quality index
- Control indoor AQI without air purifier – Dyson expert’s 5 simple habits to de-smog your home - Technology News | The Financial Express
Global Warming
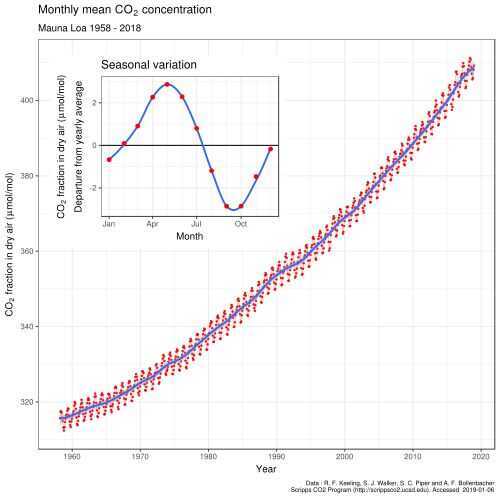
Keeling Curve
The Keeling Curve is a graph of the accumulation of carbon dioxide in the Earth's atmosphere based on continuous measurements taken at the Mauna Loa Observatory on the island of Hawaii from 1958 to the present day. The curve is named for the scientist Charles David Keeling, who started the monitoring program and supervised it until his death in 2005.
Keeling's measurements showed the first significant evidence of rapidly increasing carbon dioxide(CO2) levels in the atmosphere. According to Dr Naomi Oreskes, Professor of History of Science at Harvard University, the Keeling curve is one of the most important scientific works of the 20th century. Many scientists credit the Keeling curve with first bringing the world's attention to the current increase of CO in the atmosphere.
