Understanding UML Modeling Language
UML (Unified Modeling Language)
Unified Modelling Language (UML) is a modeling language in the field of software engineering which aims to set standard ways to visualize the design of a system. UML guides the creation of multiple types of diagrams such as interaction , structure and behaviour diagrams.
Types of UML
-
Interaction diagram
An interaction diagram is used to show theinteractive behaviorof a system. Since visualizing the interactions in a system can be a cumbersome task, we use different types of interaction diagrams to capture various features and aspects of interaction in a system.
-
Sequence diagram
A sequence diagram simply depicts interaction between objects in a sequential order i.e. the order in which these interactions take place. We can also use the terms event diagrams or event scenarios to refer to a sequence diagram. Sequence diagrams describe how and in what order the objects in a system function. These diagrams are widely used by businessmen and software developers to document and understand requirements for new and existing systems.
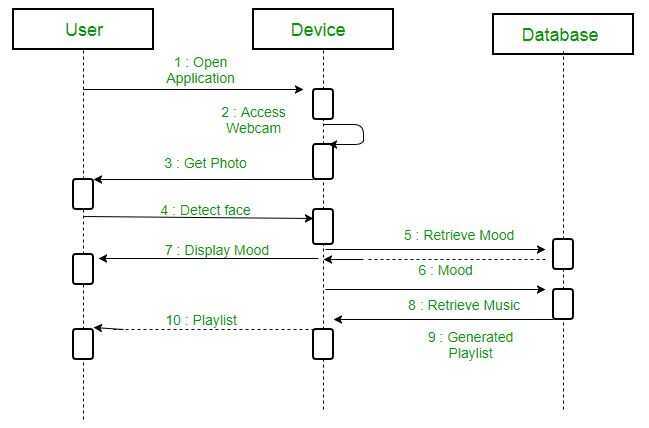
https://www.geeksforgeeks.org/unified-modeling-language-uml-sequence-diagrams
-
Flowchart
-
Usecase diagram
-
Class diagram
-
Activity diagram
-
Component diagram
-
State machine diagram
-
Object diagram
-
Deployment diagram
-
Timing diagram
-
Package diagram
-
Composite structure diagram
-
Profile diagram
-
Communication diagram
https://www.freecodecamp.org/news/uml-diagrams-full-course/
Non-UML diagrams
- Wireframe graphical interface
https://www.freecodecamp.org/news/what-is-a-wireframe-ux-design-tutorial-website- Archimate diagram
- Specification and Description Language (SDL)
- Ditaa diagram
- Gantt diagram
https://mermaidjs.github.io (Can be rendered using markdown in gitlab)
OCL (Object Constraint Language)
Business Process Model and Notation (BPMN)
Business Process Model and Notation(BPMN) is a graphical representation for specifying business processes in a business process model.
Originally developed by the Business Process Management Initiative(BPMI), BPMN has been maintained by the Object Management Group(OMG) since the two organizations merged in 2005. Version 2.0 of BPMN was released in January 2011, at which point the name was amended toBusiness Process ModelandNotationto reflect the introduction of execution semantics, which were introduced alongside the existing notational and diagramming elements. Though it is an OMG specification, BPMN is also ratified as ISO 19510. The latest version is BPMN 2.0.2, published in January 2014.
https://en.wikipedia.org/wiki/Business_Process_Model_and_Notation
Workflow
A Workflow is a series of decisions made by different people that determines what happens to a particular request that one of those people made, according to a defined and repeatable process.
SwimLane
A swimlane (or swimlane diagram) is used in process flow diagrams, or flowcharts, that visually distinguishes job sharing and responsibilities for sub-processes of a business process. Swimlanes may be arranged either horizontally or vertically.
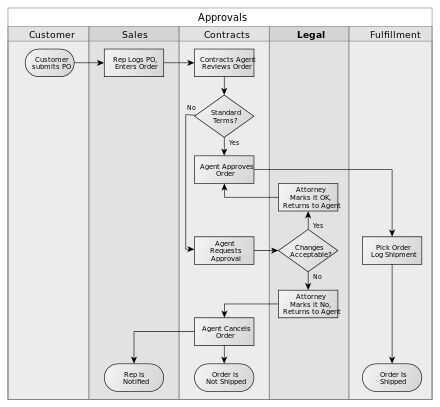
https://en.wikipedia.org/wiki/Swim_lane
C4 modeling technique
C4 modeling technique helps us to view the solution in a top-down fashion. Starting from the bigger picture and then diving deeper into the details. According to C4, there are four levels of a system.
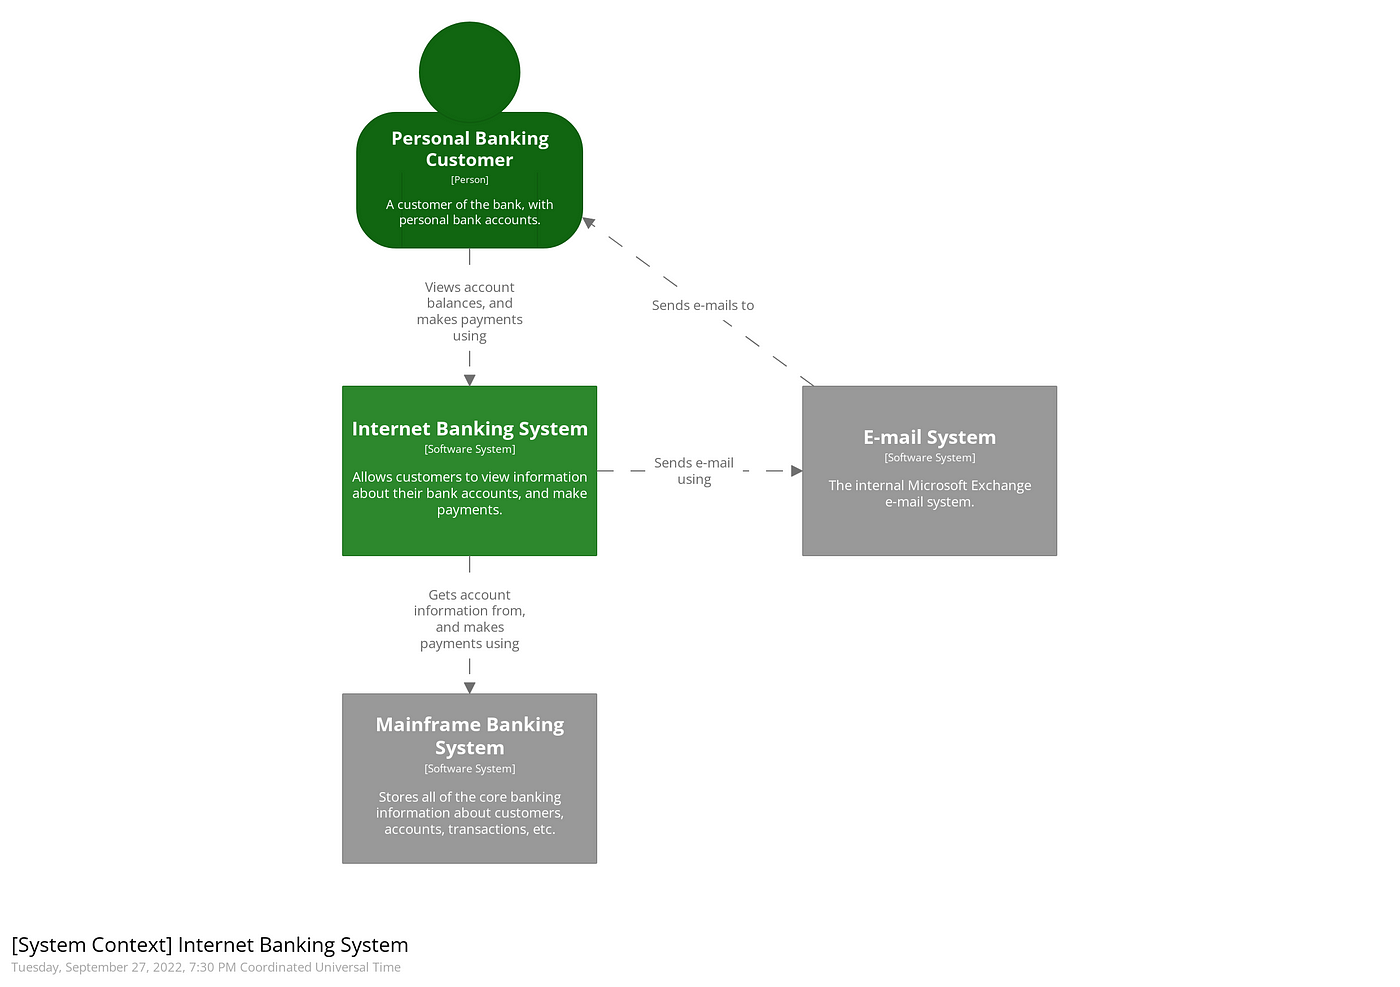
Level 1 - Context (System) Diagram
This is the bird’s eye view of the system. It defines what a system is, what it does, which other systems it interacts with, and who uses the system. Essentially it scopes the solution to who is/are the user(s) and what problem(s) is/are being solved by it.
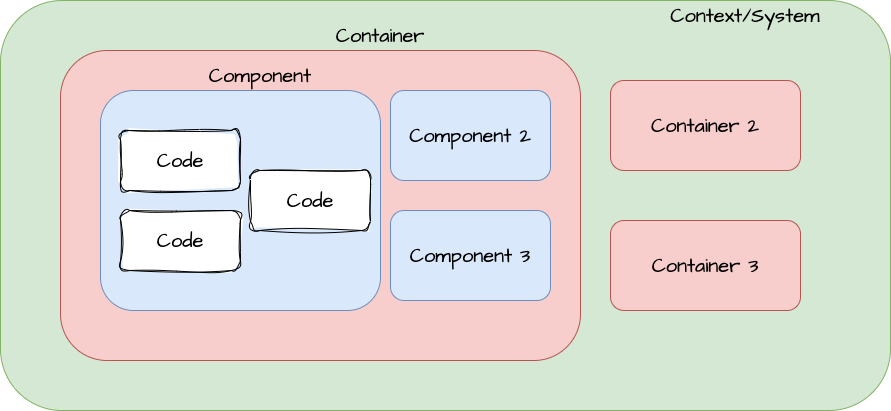
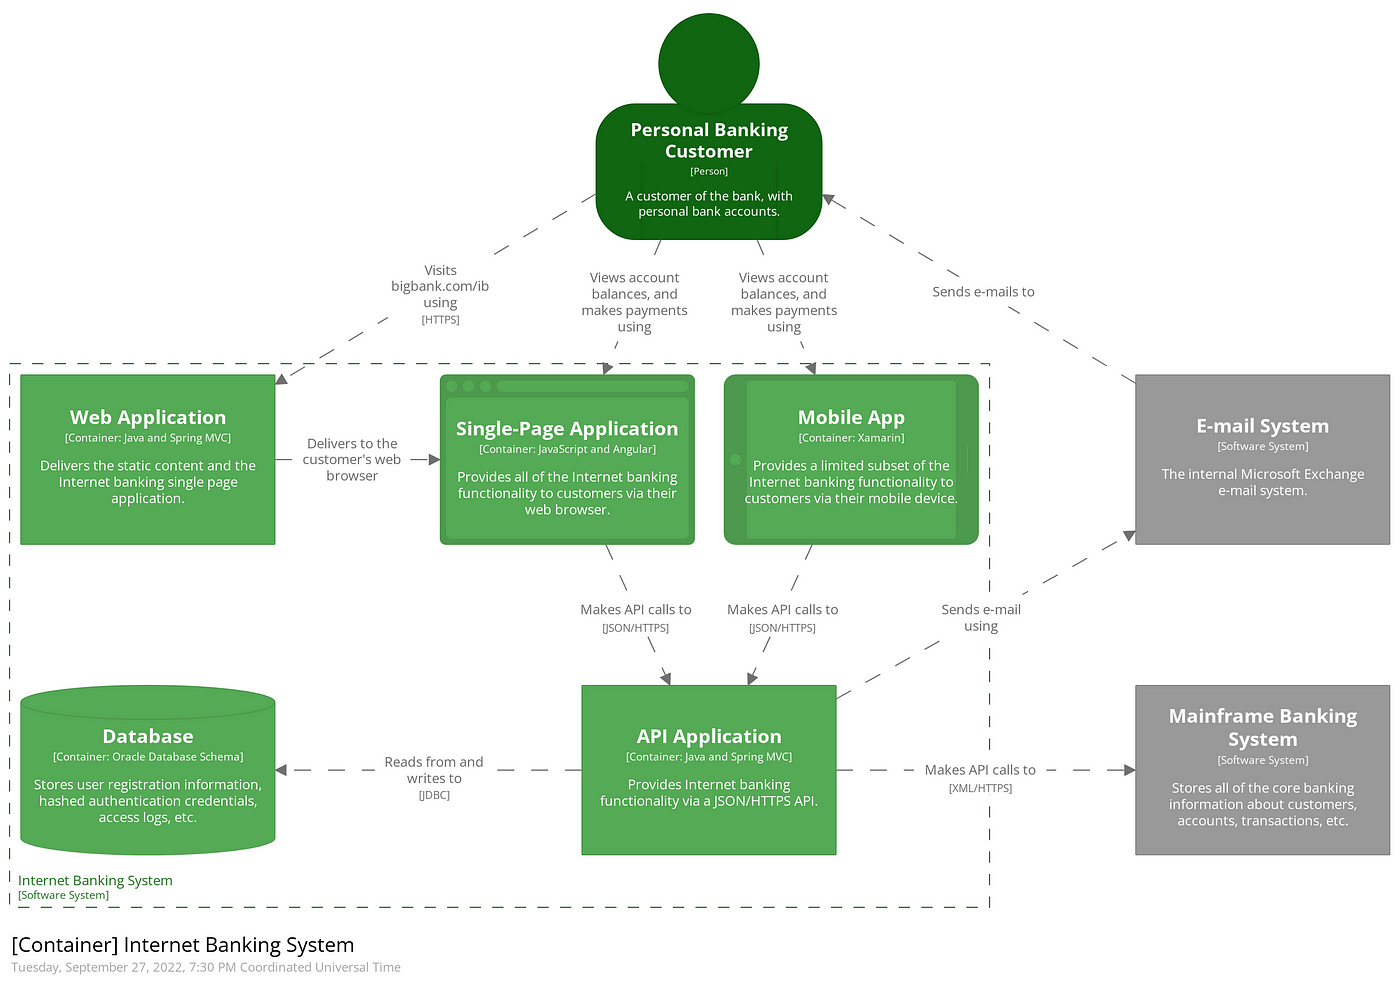
Level 2 - Container Diagram
Container here refers to any Web Application, mobile application, serverless function, database, microservices, etc that a system would use. It is the zoomed-in view of a part of a software system. Each of these applications or services is represented with a container and the interactions between them are shown at a high level.
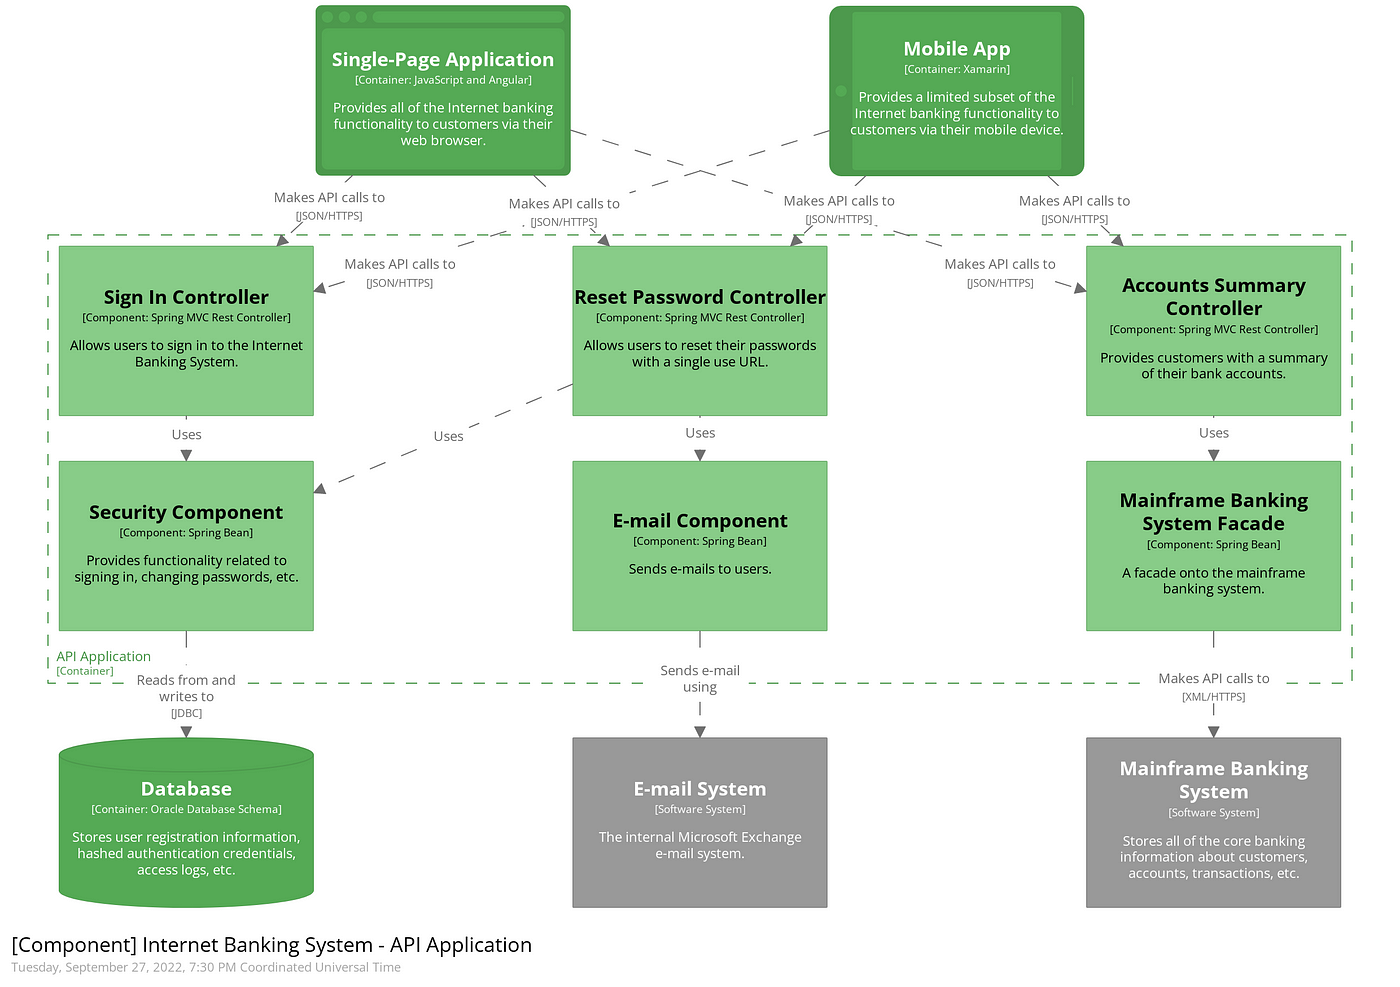
Level 3 - Component Diagram
Next we can zoom in and decompose each container further to identify the major structural building blocks and their interactions.
The Component diagram shows how a container is made up of a number of "components", what each of those components are, their responsibilities, and the technology/implementation details.
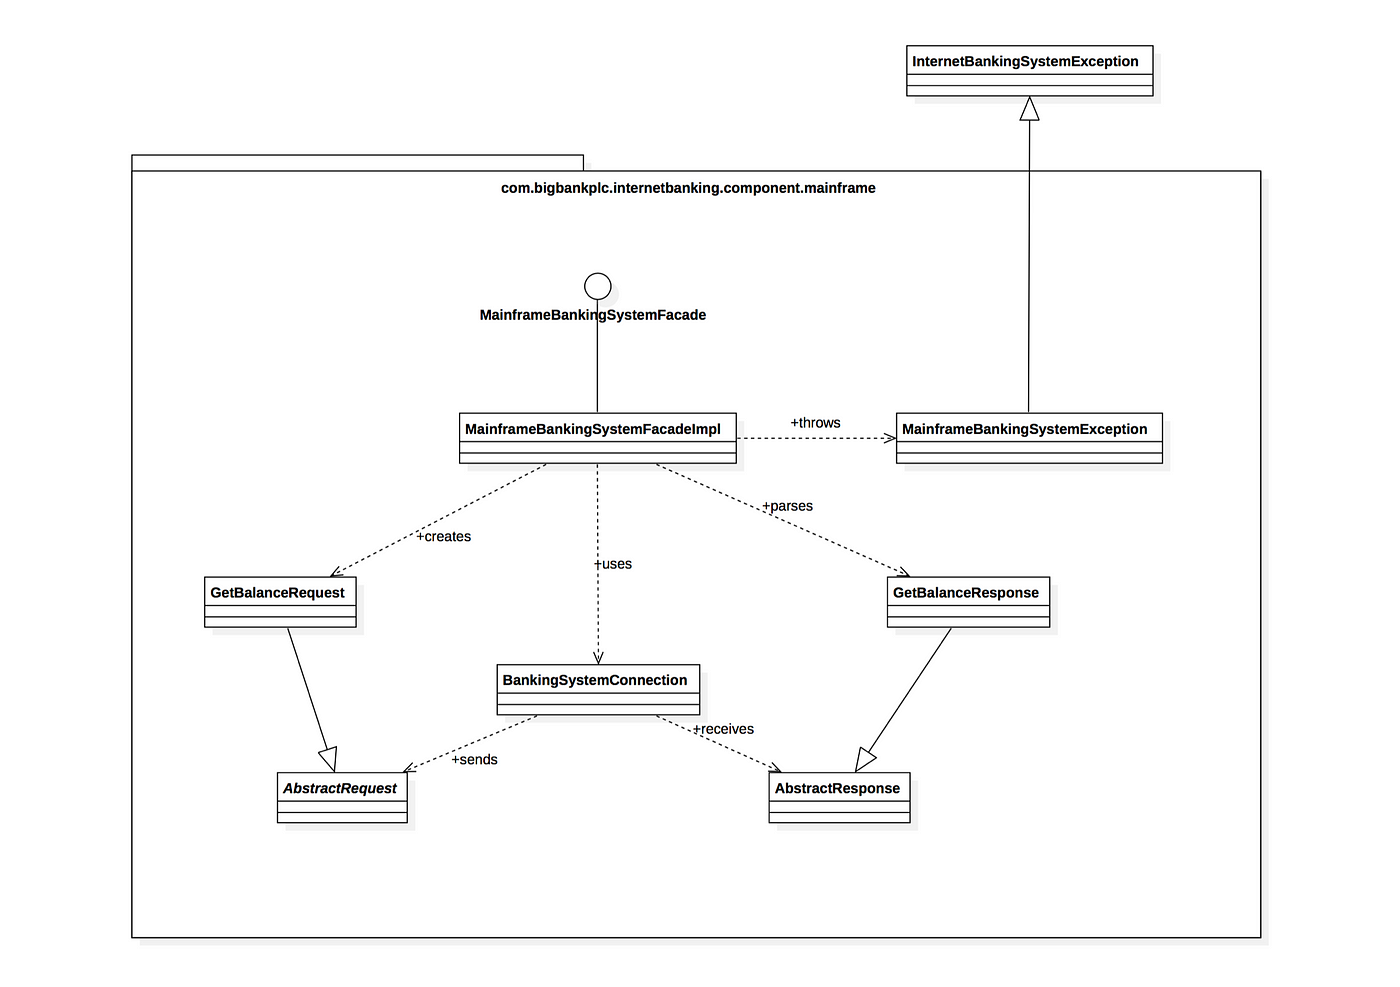
Level 4 - Code Diagrams
If we dig deeper, then we can see how each component is implemented as code use diagrams such as entity-relationship diagrams, class diagrams, etc.
This is usually a little too much detail, so we try to focus on the attributes and methods which allow us to tell the story of the component. Unnecessary details are omitted.
Mostly, the Level 4 diagram is only created when needed and the top 3 diagrams suffice the need.
C4 modeling is a great way to design software. Not just for documenting the software, but it allows us to dig into the problem from a top-down approach which allows clarity in thought leading to better solutions.
C4 Modeling - Do you see what I see | by Ipinder Singh | Medium